. 2012 May;107(10):2769-81.
doi: 10.1152/jn.00528.2011. Epub 2012 Feb 22.

Adenosine inhibits glutamatergic input to basal forebrain cholinergic neurons

Affiliations

Adenosine inhibits glutamatergic input to basal forebrain cholinergic neurons

J M Hawryluk et al. J Neurophysiol. 2012 May.

Abstract

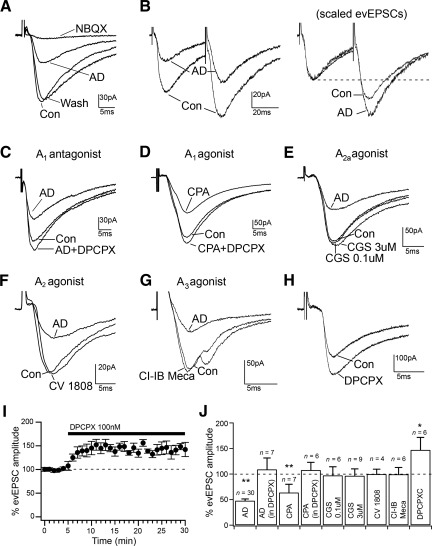
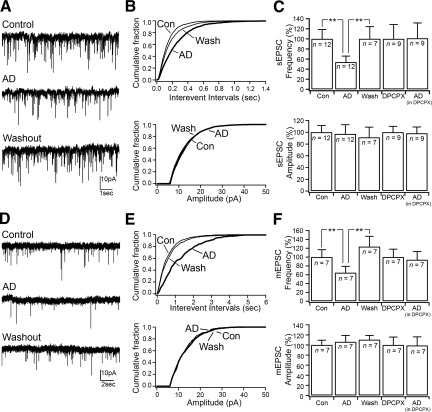
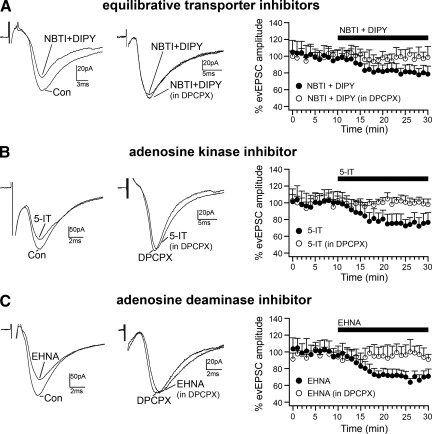
Adenosine has been proposed as an endogenous homeostatic sleep factor that accumulates during waking and inhibits wake-active neurons to promote sleep. It has been specifically hypothesized that adenosine decreases wakefulness and promotes sleep recovery by directly inhibiting wake-active neurons of the basal forebrain (BF), particularly BF cholinergic neurons. We previously showed that adenosine directly inhibits BF cholinergic neurons. Here, we investigated 1) how adenosine modulates glutamatergic input to BF cholinergic neurons and 2) how adenosine uptake and adenosine metabolism are involved in regulating extracellular levels of adenosine. Our experiments were conducted using whole cell patch-clamp recordings in mouse brain slices. We found that in BF cholinergic neurons, adenosine reduced the amplitude of AMPA-mediated evoked glutamatergic excitatory postsynaptic currents (EPSCs) and decreased the frequency of spontaneous and miniature EPSCs through presynaptic A(1) receptors. Thus we have demonstrated that in addition to directly inhibiting BF cholinergic neurons, adenosine depresses excitatory inputs to these neurons. It is therefore possible that both direct and indirect inhibition may synergistically contribute to the sleep-promoting effects of adenosine in the BF. We also found that blocking the influx of adenosine through the equilibrative nucleoside transporters or inhibiting adenosine kinase and adenosine deaminase increased endogenous adenosine inhibitory tone, suggesting a possible mechanism through which adenosine extracellular levels in the basal forebrain are regulated.


Figures

Fig. 1.
Fig. 1.
Cy3-coupled antibodies raised against mouse p75 neurotrophin receptors (Cy3-p75NTR-IgGs) specifically label cholinergic neurons in the basal forebrain (BF). Photographs show neurons of the horizontal limb of the diagonal band (hDB), magnocellular preoptic nucleus (MCPO), and substantia innominata (SI) nuclei. p75NTR-IgG label is shown in red and choline acetyltransferase (ChAT) immunoreactivity in green. A: ChAT immunostaining in the hDB shown at low magnification (left; scale bar = 100 μm). ChAT-positive neurons and p75NTR-IgG-positive neurons (boxed area) are shown at higher magnification at middle and right, respectively (scale bars = 25 μm). B: ChAT immunostaining in the MCPO and SI at the level of the crossing fibers of the anterior commissure is shown at low magnification (top row, left; scale bar = 200 μm). ChAT-positive neurons and p75NTR-IgG-positive neurons of the MCPO (bottom boxed area) and of the SI (top boxed area) are displayed at higher magnification at top row, middle and right, for MCPO and at bottom row, left and middle, for SI (scale bars = 25 μm).
Fig. 2.
Fig. 2.
A: in vivo labeling of MCPO/SI cholinergic neurons using fluorescent anti-murine p75NTR-IgGs. Two MCPO neurons were labeled with Cy3-p75NTR-IgG (left) and visualized under infrared differential interference contrast (middle), and the lower cell was filled with Lucifer yellow from the recording pipette (right). B: the recorded/Lucifer yellow-filled neuron (in green) is positive for ChAT immunoreactivity (in red). C: coronal diagrams (modified from Franklin and Paxinos 1997) represent the distribution of 17 recorded cholinergic neurons. hDB, MCPO, and SI nuclei are highlighted in gray. The number at the bottom of each diagram indicates mm anterior to bregma. D and E: firing properties of MCPO/SI neurons during depolarizing (+40 pA, from −83 mV; top traces) and hyperpolarizing current pulses (−20 pA, from −50 mV; bottom traces) showing no Ih-mediated depolarizing sag, a voltage-dependent rectification compatible with the presence of an inwardly rectifying K+ current, and delayed rebound firing on recovery from hyperpolarizing pulses due to activation of an A-type current (arrowheads) that is abolished by 5 mM 4-aminopyridine (4-AP). F: voltage-clamp recordings (1 μM TTX) of the A-type current in MCPO/SI cholinergic neurons shown as a transient outward current that is abolished by 4-AP. G: activation curve for A-type conductance (gA; see materials and methods) expressed as a fraction of maximal conductance (gAmax) and plotted against the test pulse potential (holding potential Vh = −90 mV; n = 9). The curve is the best fit of a sigmoidal function (V50 = −28.3 mV and k = 9.59 mV; χ2 < 0.001). Con, control.
Fig. 3.
Fig. 3.
Adenosine inhibits the evoked glutamatergic input to MCPO/SI cholinergic neurons through presynaptic A1 receptors. A: adenosine (100 μM) inhibits glutamatergic AMPA-receptor-mediated evoked excitatory postsynaptic currents (evEPSCs); 2,3-dioxo-6-nitro-1,2,3,4-tetrahydrobenzo[f]quinoxaline-7-sulfonamide (NBQX) was used at 10 μM. AD, adenosine. B: adenosine increases paired-pulse facilitation (PPF; paired-pulses test using 40-ms interstimulus interval). At right, scaled traces to match evEPSC (1st pulses) are represented to show the increased PPF by adenosine. C and D: adenosine inhibition of evEPSCs is blocked by the A1 receptor antagonist 8-cyclopentyl-1,3-dipropylxanthine (DPCPX; 100 nM) and is mimicked by the A1 agonist N6-cyclopentyladenosine (CPA; 100 nM). E–G: evoked glutamatergic EPSCs are unaffected by the A2A receptor agonist CGS-216800 (0.1–3 μM), the A2 receptor agonist CV-1808 (250 nM), or the A3 receptor agonist Cl-IB-MECA (100 nM). H and I: DPCPX (100 nM) increases the amplitude of evEPSCs by blocking endogenous adenosine. J: summary graph showing the averaged effects of adenosine, adenosine in the presence of DPCPX, CPA, CPA in the presence of DPCPX, CGS-21680 (0.1 and 3 μM), CV-1808, Cl-IB-MECA, and DPCPX on evEPSC amplitude. *P < 0.05;**P < 0.01, paired t-test, comparing evEPSC amplitude in control artificial cerebrospinal fluid (ACSF) and during drug applications. All evEPSCs were recorded at Vh = −70 mV.
Fig. 4.
Fig. 4.
Adenosine inhibits spontaneous glutamatergic input through presynaptic A1 receptors. A: effects of adenosine (100 μM) on the glutamatergic spontaneous EPSC (sEPSC). B: cumulative distribution plots of the sEPSC interevent intervals and amplitude (number of sEPSCs: control = 2,118; AD = 1,180; and wash = 1,830) of the cell represented in A. C: bar graphs showing the mean effects of adenosine applied alone and in the presence of DPCPX on sEPSC frequency and amplitude. In control ACSF: adenosine effects on sEPSC frequency [F(6,2) = 6.662, P = 0.011, 1-way ANOVA (**P < 0.01, Fisher's PLSD)] and on sEPSC amplitude [F(6,2) = 1.103, P = 0.363, 1-way ANOVA]. In the presence of DPCPX: adenosine effects on sEPSC frequency [F(8,1) = 0.022, P = 0.886, 1-way ANOVA] and on sEPSC amplitude [F(8,1) = 0.346, P = 0.573, 1-way ANOVA]. D: effects of adenosine on glutamatergic miniature EPSCs (mEPSCs) recorded in TTX (1 μM). E: cumulative distribution plots of mEPSC interevent intervals and amplitude (number of mEPSCs: control = 531; AD = 245; and wash = 432) of the cell represented in D. F: bar graphs showing the mean effects of adenosine applied alone and in the presence of DPCPX on mEPSC frequency and amplitude. In control ACSF: adenosine effects on mEPSC frequency [F(5,2) = 11.157, P = 0.003, 1-way ANOVA (**P < 0.01, Fisher's PLSD)] and on mEPSC amplitude [F(5,2) = 0.901, P = 0.437, 1-way ANOVA]. In the presence of DPCPX: adenosine effects on mEPSC frequency [F(8,1) = 0.022, P = 0.886, 1-way ANOVA] and on sEPSC amplitude [F(6,1) = 0.744, P = 0.421, 1-way ANOVA]. sEPSCs and mEPSCs were recorded at Vh = −70 mV.
Fig. 5.
Fig. 5.
Regulation of endogenous adenosine tone. A: the equilibrative nucleoside transporter inhibitors S-(4-nitrobenzyl)-6-thioinosine (NBTI; 5 μM) + dipyridamole (DIPY; 10 μM) reduce the amplitude of evEPSCs in BF cholinergic neurons, and this effect is blocked in the presence of DPCPX (500 nM). B: effect of the adenosine kinase inhibitor 5-iodotubercidin (5-IT; 7 μM) on evEPSC amplitude. C: effect of the adenosine deaminase inhibitor erythro-9-(2-hydroxy-3-nonyl)adenine hydrochloride (EHNA; 10 μM) on evEPSC amplitude. All evEPSCs were recorded at Vh = −70 mV. Time courses of the effects of NBTI + DIPY, 5-IT, and EHNA applied in control ACSF (●) and in the presence of DPCPX (○) are shown in graphs at right.

References

    1. Abrahamson EE, Leak RK, Moore RY. The suprachiasmatic nucleus projects to posterior hypothalamic arousal systems. Neuroreport 12: 435–440, 2001 - PubMed
    1. Achermann P, Borbely AA. Mathematical models of sleep regulation. Front Biosci 8: s683–s693, 2003 - PubMed
    1. Ackley MA, Governo RJ, Cass CE, Young JD, Baldwin SA, King AE. Control of glutamatergic neurotransmission in the rat spinal dorsal horn by the nucleoside transporter ENT1. J Physiol 548: 507–517, 2003 - PMC - PubMed
    1. Alam MN, Szymusiak R, Gong H, King J, McGinty D. Adenosinergic modulation of rat basal forebrain neurons during sleep and waking: neuronal recording with microdialysis. J Physiol 521: 679–690, 1999 - PMC - PubMed
    1. Allen Institute for Brain Science. Allen Brain Atlas. (Online). http://www.brain-map.org.

Publication types

MeSH terms