. 2012 Feb 22;32(8):2608-18.
doi: 10.1523/JNEUROSCI.5547-11.2012.

The representation of biological classes in the human brain

Affiliations

The representation of biological classes in the human brain

Andrew C Connolly et al. J Neurosci. .

Abstract

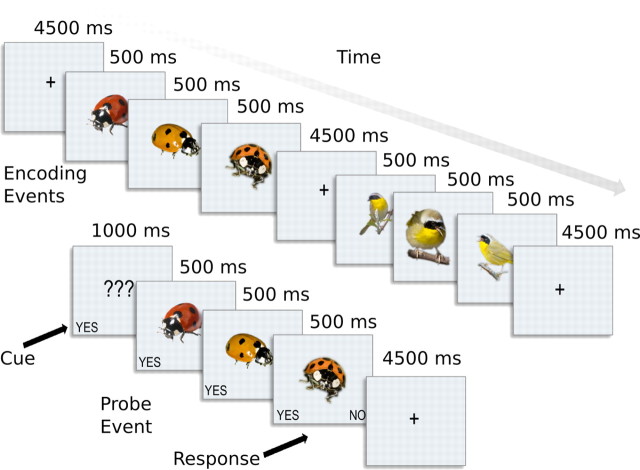
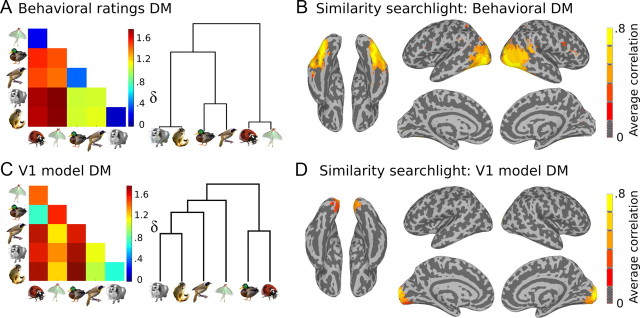
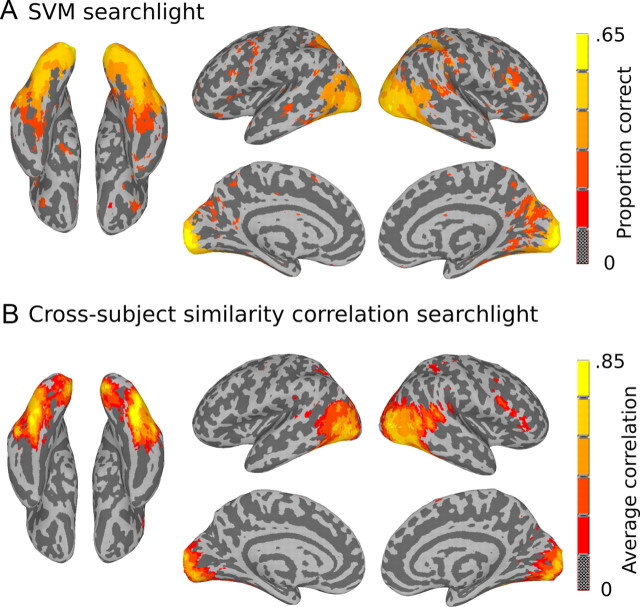
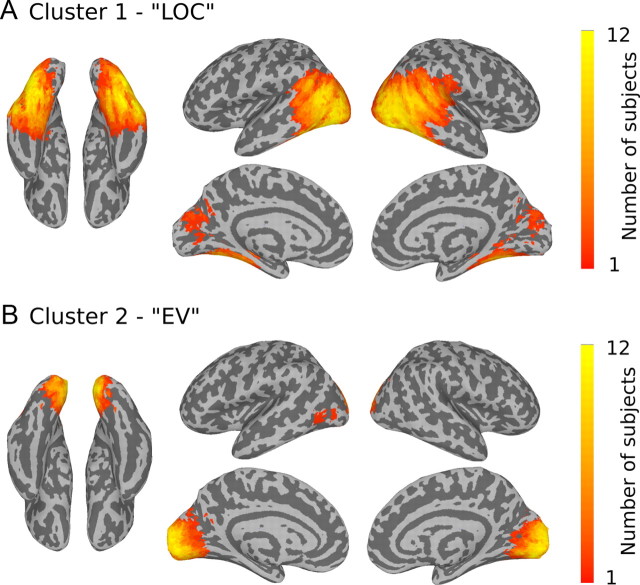
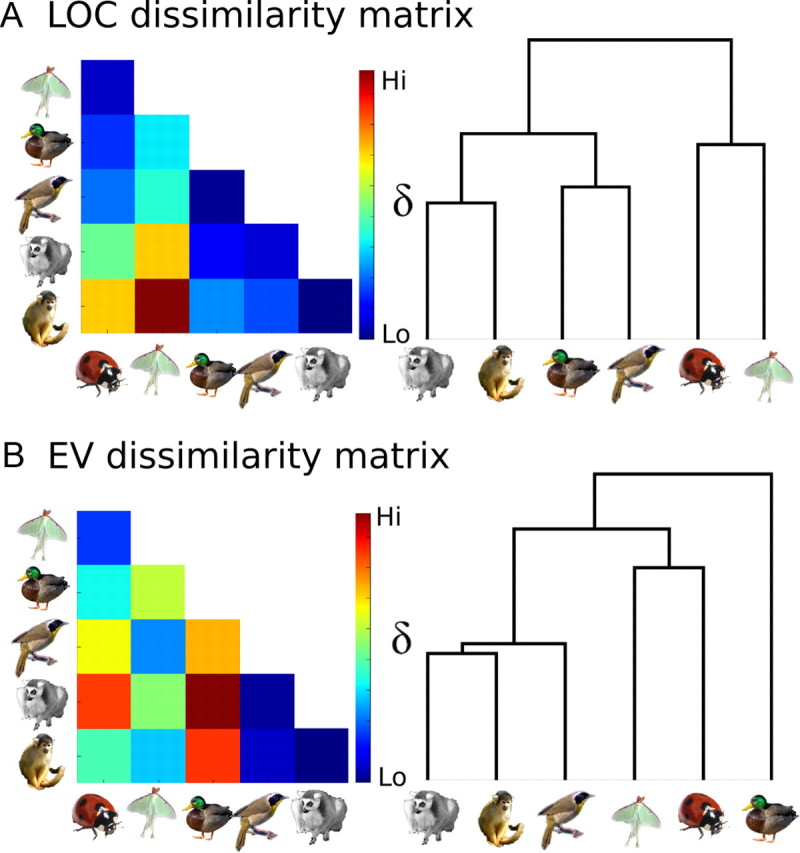
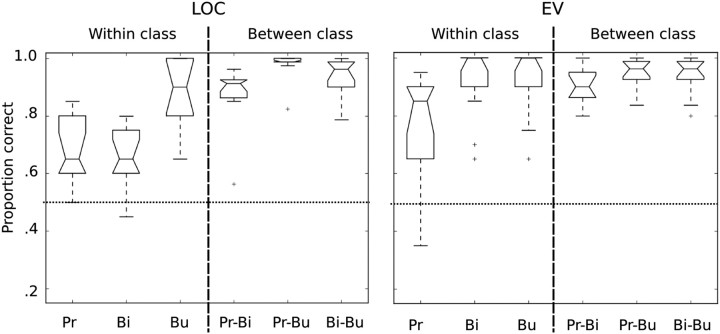
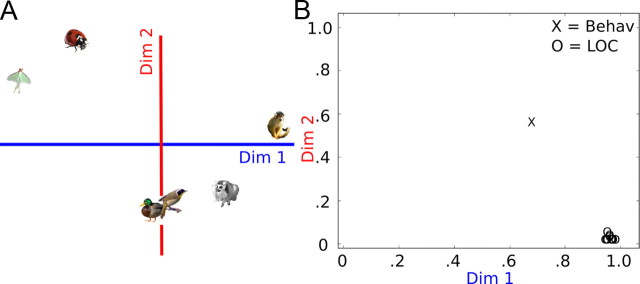
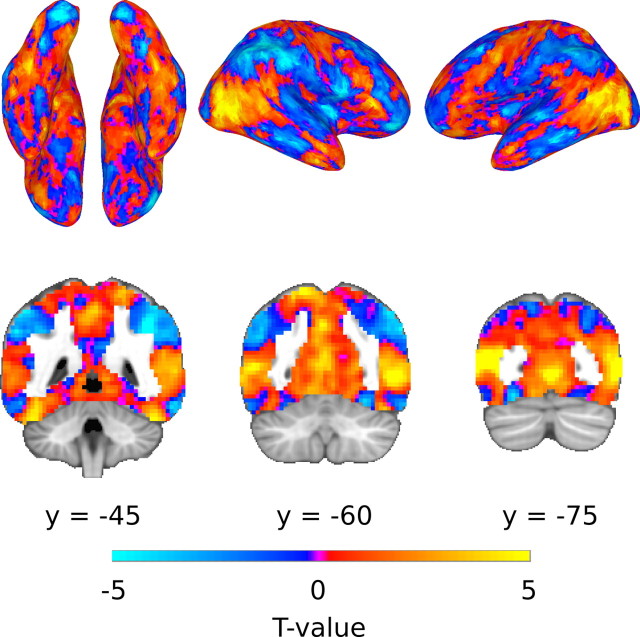
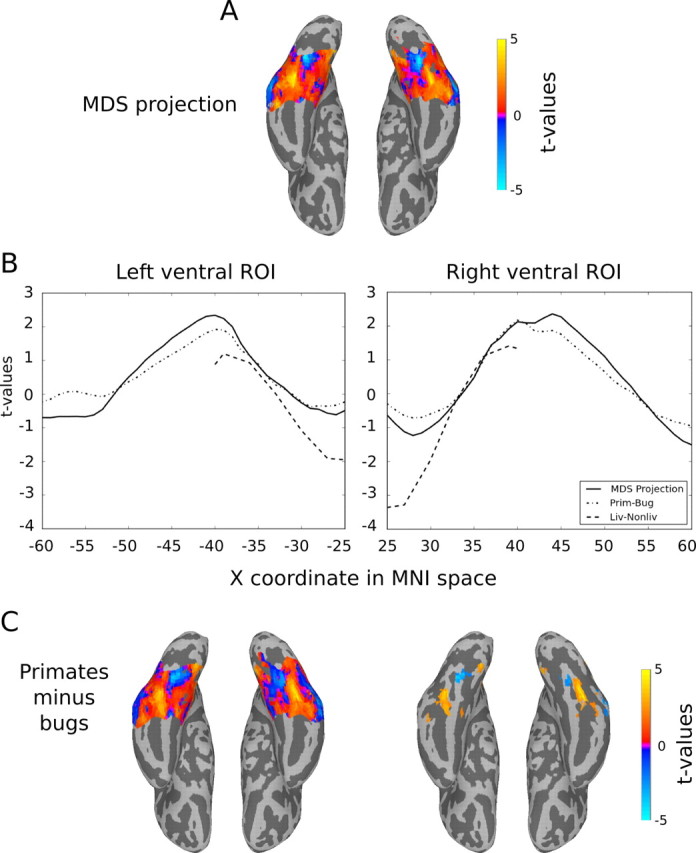
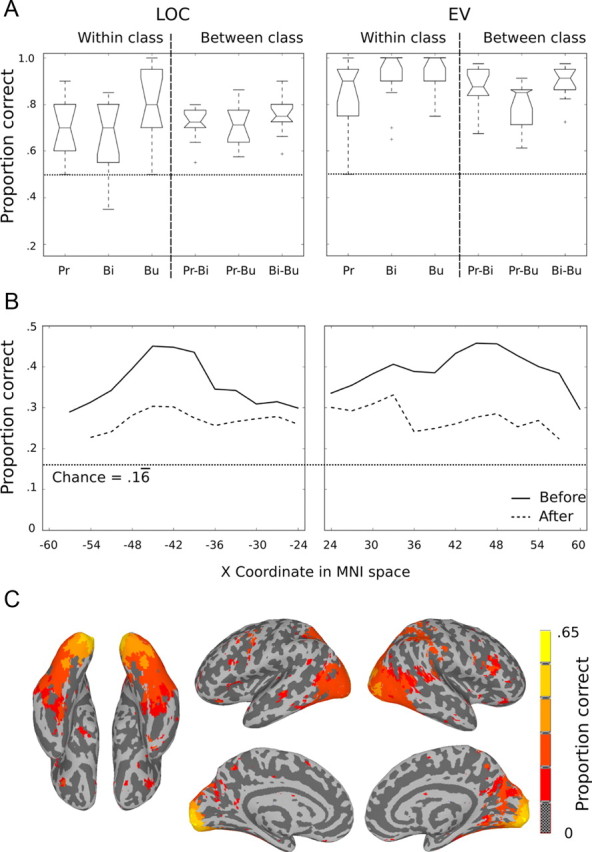
Evidence of category specificity from neuroimaging in the human visual system is generally limited to a few relatively coarse categorical distinctions-e.g., faces versus bodies, or animals versus artifacts-leaving unknown the neural underpinnings of fine-grained category structure within these large domains. Here we use fMRI to explore brain activity for a set of categories within the animate domain, including six animal species-two each from three very different biological classes: primates, birds, and insects. Patterns of activity throughout ventral object vision cortex reflected the biological classes of the stimuli. Specifically, the abstract representational space-measured as dissimilarity matrices defined between species-specific multivariate patterns of brain activity-correlated strongly with behavioral judgments of biological similarity of the same stimuli. This biological class structure was uncorrelated with structure measured in retinotopic visual cortex, which correlated instead with a dissimilarity matrix defined by a model of V1 cortex for the same stimuli. Additionally, analysis of the shape of the similarity space in ventral regions provides evidence for a continuum in the abstract representational space-with primates at one end and insects at the other. Further investigation into the cortical topography of activity that contributes to this category structure reveals the partial engagement of brain systems active normally for inanimate objects in addition to animate regions.


Figures

Figure 1.
Figure 1.
Slow event-related fMRI design. During fMRI scanning, subjects engaged in a simple recognition memory task to ensure attention was paid to each stimulus. During encoding events images were presented in sequences of three exemplars of the same class. A set of six encoding events—one for each stimulus class—was followed by a probe event, which prompted subjects to answer yes or no depending on whether the probe was identical to one of the encoding events.
Figure 2.
Figure 2.
Similarity searchlight analyses. A, DM based on behavioral ratings and corresponding dendrogram. B, Whole-brain searchlight results for correlation with behavioral DM. Neural DMs evaluated within searchlight spheres (radius = 9 mm) correlated significantly with the behavioral DM throughout the LOC region, but not in early visual regions of the occipital pole. C, DM based on V1 model of stimuli and corresponding dendrogram. D, Searchlight results for correlation with V1 model. Neural DMs for searchlight spheres correlated with the V1 model in the medial occipital pole. Searchlight maps show the average Pearson product-moment correlation with the target DMs (A, C) across subjects in MNI standard space. Maps are thresholded at t(11) = 4.41, p < 0.001, one-sample t test for z > 0, for z-values converted from permutation-based p values.
Figure 3.
Figure 3.
A, Searchlight results for six-way SVM classification. Classification performance was high throughout visual cortex and in other parts of the brain. The highest classification accuracy was observed in the occipital pole: mean proportion correct = 0.64 (x = 9, y = −93, z = 3). The map is thresholded at t(11) = 5.9, p < 0.0001, for values greater than chance (0.1̄6). B, Searchlight results for correlation between DMs calculated within searchlight spheres for different subjects. Mapped values reflect the average correlation across subjects for each searchlight sphere in MNI space. High across-subject correlations were observed throughout EV cortex and the LOC region. The highest cross-subject correlations were observed in right fusiform gyrus: mean = 0.85 (x = 39, y = −63, z = −15).
Figure 4.
Figure 4.
Definitions of ROIs, LOC, and EV, by maximizing across-subject reproducibility. DMs defined by searchlight spheres from all subjects were clustered to identify two major groups of similarity structures. The searchlight centers were then coded by cluster and mapped back into individual brains. A, The largest cluster was formed by DMs from voxels throughout LOC. B, The second largest cluster was formed by DMs from voxels in EV. Searchlight DMs in both clusters included voxels from every subject. The maps show the overlap of voxels from different subjects in MNI space for Clusters 1 and 2.
Figure 5.
Figure 5.
A, B, Average neural DMs and corresponding dendrograms for LOC (A) and EV (B). The mean between-subject correlations for neural DMs were r = 0.94 for LOC and r = 0.71 for EV. The correlation between the average LOC DM (A) and the behavioral DM (Fig. 2A) was r = 0.76, and between the EV DM (B) and the V1 model DM (Fig. 2C) was r = 0.78. The correlation between the average EV and LOC DMs was r = 0.09.
Figure 6.
Figure 6.
Accuracies for pairwise SVM classification within LOC (left) and EV (right). Classification accuracies were significantly above chance for all pairs of stimuli within and between superordinate classes in LOC; however, overall accuracies were higher for between-class pairs than within-class pairs. The best discrimination was observed between primates and bugs. Classification accuracies in EV were all well above chance for all stimulus pairings. Pr, primates; Bi, birds; Bu, bugs. Boxplots show the upper and lower quartiles of the distribution of values across subjects (top and bottom extents of the boxes), the median (center line), the range within 150% of the inner quartile (whiskers), and outliers (crosshairs).
Figure 7.
Figure 7.
MDS of DMs from LOC and behavioral ratings. A, 2D MDS solution that reflects the best fit Euclidean distances for all 13 input matrices (12 subjects plus the behavioral DM) computed using individual differences scaling (Takane et al., 1977). B, Individual differences are reflected in the weights assigned to each dimension for each input matrix. The weights reflect the importance of each dimension to each DM. The LOC DMs all have high weights on Dimension 1 and low weights on Dimension 2. Four subjects had weights equal to zero on Dimension 2, which means that the MDS solutions for those subjects are equivalent to a projection of the stimulus points onto the x-axis in A, and scaled along the x-axis by the weight on Dimension 1. Thus, for those subjects a single-dimensional solution with primates at one end and bugs at the other accounted for the most variance in LOC. Dim, Dimension.
Figure 8.
Figure 8.
Projection of Dimension 1 (Fig. 7) onto the β-weights for the six categories. Positive values correspond to a positive correlation between β-weights and the values along Dimension 1, i.e., the highest positive values indicate voxels where activity was greatest for monkeys and lowest for luna moths, while strong negative values indicate greater activity for luna moths and less for monkeys. The colors indicate t values from a group analysis for projected values different from zero. Values of |t(11)| > 3.11 have p < 0.01; however, the full range of values are shown to highlight the consistent bilateral distribution of activity correlated with Dimension 1.
Figure 9.
Figure 9.
Comparison of the projection of the bugs-to-primates dimension (Fig. 7) to the living–nonliving contrast from Mahon et al. (2009). Using a method described by Mahon et al. (2009), we calculated the medial-to-lateral index for the projected Dimension 1 from the MDS analysis (Fig. 8). A, The colored regions show the extent of the mask used in the analysis, and the colors reflect the unthresholded t values for the group result. The mask we used covers a greater extent of the ventral surface in the medial-to-lateral dimension than that reported by Mahon et al. (2009). While these extra data points played no role in the comparison with the living–nonliving contrast, they illustrate the extent of consistent activity across the ventral surface. B, The medial-to-lateral index for our results and for living–nonliving. The values reported for the living–nonliving contrast were kindly provided to us by Brad Mahon and are also plotted in Mahon et al. (2009; their Fig. 5B, p. 402). The linear fits between our data and the living–nonliving contrast were highly significant with R2 of 0.83 and 0.82 for the left and right ROIs, respectively. C, For comparison, we present the results of the contrast of primates and bugs within the left and right ventral ROIs. The unthresholded contrast on the left shows a nearly identical pattern to that of the Dimension 1 projection, which is also reflected by the medial-to-lateral index calculated for the primates–bugs contrast (B). On the right, we plot all voxels that pass a statistical threshold (t(11) > 2.2, p < 0.05) for the contrast. Blue voxels reveal bilateral medial regions in which the activity for bugs was greater than that for primates; warm-colored voxels reveal bilateral regions in the lateral fusiform in which activity was greater for primates.
Figure 10.
Figure 10.
The effect of removing variance accounted for by Dimension 1 on classification accuracy. A, Pairwise classification accuracies for LOC and EV after removing variance accounted for by Dimension 1. Compare to Figure 6. B, Six-way SVM classification as a function of medial-to-lateral coordinates before and after removing variance accounted for by Dimension 1. C, Six-way SVM searchlight after removing Dimension 1 variance. Colored voxels show areas of classification accuracy that were significantly above chance using the same threshold as in Figure 3A (t(11) > 5.9, p < 0.0001). Pr, Primates; Bi, birds; Bu, bugs.

References

    1. Aguirre GK. Continuous carry-over designs for fMRI. Neuroimage. 2007;35:1480–1494. - PMC - PubMed
    1. Beauchamp MS, Lee KE, Haxby JV, Martin A. Parallel visual motion processing streams for manipulable objects and human movements. Neuron. 2002;34:149–159. - PubMed
    1. Beauchamp MS, Lee KE, Haxby JV, Martin A. fmri responses to video and point-light displays of moving humans and manipulable objects. J Cogn Neurosci. 2003;15:991–1001. - PubMed
    1. Berlin B. Ethnobiological classification: principles of categorization of plants and animals in traditional societies. Princeton, NJ: Princeton UP; 1992.
    1. Caramazza A, Shelton JR. Domain-specific knowledge systems in the brain the animate-inanimate distinction. J Cogn Neurosci. 1998;10:1–34. - PubMed

Publication types

MeSH terms

LinkOut - more resources