. 2012 Feb 22;32(8):2722-33.
doi: 10.1523/JNEUROSCI.5221-11.2012.

Phospholipase C-mediated suppression of dark noise enables single-photon detection in Drosophila photoreceptors

Affiliations

Phospholipase C-mediated suppression of dark noise enables single-photon detection in Drosophila photoreceptors

Ben Katz et al. J Neurosci. .

Abstract

Drosophila photoreceptor cells use the ubiquitous G-protein-mediated phospholipase C (PLC) cascade to achieve ultimate single-photon sensitivity. This is manifested in the single-photon responses (quantum bumps). In photoreceptor cells, dark activation of G(q)α molecules occurs spontaneously and produces unitary dark events (dark bumps). A high rate of spontaneous G(q)α activation and dark bump production potentially hampers single-photon detection. We found that in wild-type flies the in vivo rate of spontaneous G(q)α activation is very high. Nevertheless, this high rate is not manifested in a substantially high rate of dark bumps. Therefore, it is unclear how phototransduction suppresses dark bump production arising from spontaneous G(q)α activation, while still maintaining high-fidelity representation of single photons. In this study we show that reduced PLC catalytic activity selectively suppressed production of dark bumps but not light-induced bumps. Manipulations of PLC activity using PLC mutant flies and Ca(2+) modulations revealed that a critical level of PLC activity is required to induce bump production. The required minimal level of PLC activity selectively suppressed random production of single G(q)α-activated dark bumps despite a high rate of spontaneous G(q)α activation. This minimal PLC activity level is reliably obtained by photon-induced synchronized activation of several neighboring G(q)α molecules activating several PLC molecules, but not by random activation of single G(q)α molecules. We thus demonstrate how a G-protein-mediated transduction system, with PLC as its target, selectively suppresses its intrinsic noise while preserving reliable signaling.


Figures

Figure 1.
Figure 1.
Dark bumps are the result of spontaneous GDP-GTP exchange on the Gqα subunit. A, Histogram plotting the mean bump rate of dark bumps of WT and Gqα1 heterozygote (Gqα1/+) and homozygote mutant raised either in the dark or in the light (n = 5, mean ± SEM). B, Scatter plot of dark bump rate as a function of Gqα protein levels in the membrane of different mutants and rearing conditions as in A. Note the highly significant linear relationship between these two parameters [mean ± SEM; data of Gqα protein levels in the membrane were taken from the work of Frechter et al. (2007)]. C, Whole-cell recordings of dark bumps from WT and Gβe1 heterozygote (Gβe1/+) mutant flies using extracellular solution with 1.5 mm Ca2+ and a pipette solution with either KGlu (no GDP) or KGlu (8 mm GDP) (Table 2). D, Histogram plotting the mean dark bump rate of the mutant flies at the designated conditions. Note that adding GDP to the recording pipette decreases dark bump rate (n = 5, mean ± SEM, *p < 0.05, ***p < 0.001).
Figure 2.
Figure 2.
Reduced external Ca2+ eliminates dark bump activity while the amplitudes of light-induced bumps are enhanced. A, Whole-cell recordings from WT flies in total darkness and in dim light stimulation of 1 effective photon/s (EP/s) under 1.5 mm Ca2+ (top trace) and low Ca2+ conditions (bottom trace). Note that no dark bump activity is seen under low Ca2+ conditions, while a response to light stimulation is observed. In extracellular solution containing 1.5 mm Ca2+, dark bumps appear and light response is maintained. B, Whole-cell recordings from WT and Gβe1/+ mutant flies at total darkness under 1.5 mm Ca2+ and low Ca2+ conditions. Note the summation of dark bumps (arrow). Also note the high dark bump rate of Gβe1/+ mutant flies and the highly reduced dark bump activity under low Ca2+ conditions. C, Histogram plotting the mean dark bump rate of the mutant flies at the designated conditions (n = 5, mean ± SEM, **p < 0.01, ***p < 0.001). D, RMS of current fluctuation of dark and light (1 EP/s) responses, at the designated conditions (n = 5, mean ± SEM). Note, the low RMS under low Ca2+ compared with 1.5 mm Ca2+ conditions in the dark and the high RMS at low Ca2+ compared with 1.5 mm Ca2+ conditions in the light. Also, note the similarity between the RMS of Gβe1/+ dark and WT light under 1.5 mm Ca2+. E, Whole-cell recordings in total darkness from Gβe1/+ mutant flies under low Ca2+ conditions with intracellular solution without ATP (top trace) or with 1 mm ATP in the pipette (bottom trace) (n = 3). Note that dark bumps reappear at these conditions.
Figure 3.
Figure 3.
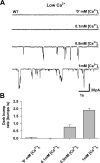
Under low external Ca2+ conditions, elevating Ca2+ concentration in the patch-pipette solution results in reappearance of dark bumps in a dose-dependent manner. A, Whole-cell recordings from WT photoreceptors at total darkness and under low external Ca2+ conditions under various concentrations of Ca2+ in the recording pipette. B, Histogram plotting the mean bump rate of dark bumps at the different conditions. Note that the bump rate increased in a dose-dependent manner (n = 5, mean ± SEM).
Figure 4.
Figure 4.
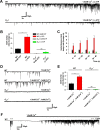
Dark bump activity is dramatically increased when omitting ATP from the recording pipette or by increasing intracellular Ca2+. A, Dark bump activity from WT and Gqα1 mutant flies using 1.5 mm Ca2+ containing extracellular solution and pipette solution with no ATP. Note that in WT flies both the rate and amplitude are increased through time, while in Gqα1 mutant flies dark bumps are scarce. B, Histogram plotting the mean bump rate with 4 mm ATP and without ATP in the recording pipette of WT and Gqα1 mutant flies (the color code applies also to C and D, n = 4, mean ± SEM, **p < 0.01; ns, not significant, p > 0.05). C, Histogram plotting the mean instantaneous dark bump rate with 4 mm ATP and without ATP of 10 s intervals (n = 4, mean ± SEM). Note the increase in the mean instantaneous dark bump rate in WT flies when ATP is omitted from the recording pipette solution while, no change in the instantaneous dark bump rate when 4 mm ATP is added to the recording pipette solution. D, Dark bump rate is increased when adding 1 mm Ca2+ to the recording pipette solution under 1.5 mm external Ca2+ conditions compared with normal pipette solution. E, Histogram plotting the mean bump rate with 1 mm and without Ca2+ in the recording pipette (n = 4, mean ± SEM, **p < 0.01; ns, not significant, p > 0.05). F, Whole-cell recordings from WT flies under low Ca2+ condition and the effect of perfusion with Ca2+ containing extracellular solution. Quantum bumps produced by light stimulation of 10 EP/s at both conditions is also demonstrated. Note that no dark activity is seen under low Ca2+ conditions while a response to light stimulation is observed. In extracellular solution containing 1.5 mm Ca2+, dark bumps appear at a higher than normal rate and a light response can hardly be detected. Also note that addition of 1.5 mm Ca2+ induced a small outward current due to temporary reverse activation of the electrogenic Na+-Ca2+ exchanger, which transports Ca2+ into the cell.
Figure 5.
Figure 5.
The Gqα1mutant fly shows highly reduced sensitivity to light at low Ca2+ compared with 1.5 mm Ca2+ conditions. A, Intensity–response (R–logI) relationship of WT (triangles) and Gqα1 mutant (circles) flies under low Ca2+, 1.5 mm Ca2+ and under low Ca2+ conditions with 1 mm Ca2+ in the recording pipette solution. Note that the WT (R–logI) relationship was shifted to the left when measured under low Ca2+ conditions compared with 1.5 mm Ca2+ while, R–logI relationship of the Gqα1 mutant was shifted to the right. Addition of 1 mm Ca2+ to the recording pipette solution partially rescued the low sensitivity of the Gqα1 under low Ca2+ conditions. Moreover, note that at extremely high intensities of 1.5 × 10⁷ EP/s under low Ca2+ condition the response amplitude of Gqα1 photoreceptors is very small. Inset: Intensity–response (logR–logI) relationship (n = 5, mean ± SEM). B, A representative light-induced response of WT and Gqα1 mutant to 103 and 106 EP/s respectively, under 1.5 mm Ca2+, low Ca2+ and under low Ca2+ conditions with 1 mm Ca2+ in the recording pipette solution. C, Western blot analysis of heads homogenate of dark raised WT, Gqα1, Gqα1/+ and norpA mutant alleles (norpAP24, norpAP57, norpAH43) using specific Drosophila antibodies for Gqα and MOESIN as indicated. Bottom panel shows a histogram plotting the relative density of the corresponding Gqα bands of the different fly strains (n = 3, mean ± SEM).
Figure 6.
Figure 6.
The norpAP57 hypomorph show highly reduced light sensitivity under low Ca2+ conditions compared with 1.5 mm Ca2+. A, A model of the initial stages of phototransduction underlying dark bump production (top) and quantum bump production (bottom). B, Western blot analysis of heads homogenate of dark raised WT, norpA mutant alleles (norpAP24, norpAP57, norpAH43) and Gqα1 mutant using specific Drosophila antibodies for NORPA and MOESIN as indicated. Bottom panel shows a histogram plotting the relative density of the corresponding NORPA bands of the different fly strains (n = 3, mean ± SEM). C, Dark bumps are observed in norpAP57 at total darkness under 1.5 mm Ca2+ conditions (top trace). Low Ca2+ condition abolished the dark activity (middle trace). Addition of 1 mm Ca2+ to the recording pipette solution resulted in the reappearance of dark bumps under low Ca2+ conditions (bottom trace) (n = 4). D, Intensity–response (R–logI) relationship of norpAP57 mutant flies under low Ca2+, 1.5 mm Ca2+ and under low Ca2+ conditions with 1 mm Ca2+ in the recording pipette solution. Note that under low Ca2+ conditions drastically reduced the light response, compared with 1.5 mm Ca2+ while addition of 1 mm Ca2+ to the recording pipette solution rescued the low sensitivity under low Ca2+ conditions. Moreover, note that at extremely high intensities of 1.5 × 10⁷ EP/s under low Ca2+ conditions the response amplitude of norpAP57 photoreceptors are very small. Inset: Intensity–response (logR–logI) relationship (n = 5, mean ± SEM). E, A representative light-induced responses of norpAP57 mutant to 104 EP/s under 1.5 mm Ca2+, low Ca2+ and under low Ca2+ conditions with 1 mm Ca2+ in the recording pipette solution.
Figure 7.
Figure 7.
The norpAH43 mutant with low PLC catalytic activity shows no dark bumps, reduced quantum bump rate and amplitude, and a highly reduced sensitivity to light under low Ca2+ conditions. A, Dark bumps are not observed in norpAH43 at total darkness under 1.5 mm Ca2+ conditions (top trace) and under 1.5 mm Ca2+ conditions with the addition of 1 mm Ca2+ to the patch-pipette solution (bottom trace) (n = 4). B, Light-induced bumps in norpAH43 mutant flies in response to light intensity of 10 EP/s (top trace) and in WT flies to light intensities of 10 EP/s (middle trace) and 1 EP/s (bottom trace) (n = 4). Note that the light-induced bumps of the mutant are small, while their kinetics are as fast as those of WT bumps. C, Histogram plotting distribution of bump amplitude of WT dark bumps, WT quantum bumps and norpAH43 quantum bumps (n = 117). Inset, Gaussian fits to the amplitude distribution histograms (mean peak amplitude; WT dark = 7.4 pA, WT light = 22.6 pA and norpAH43 light = 7.6 pA). D, Intensity–response (R–logI) curve of norpAH43 mutant flies under low Ca2+, 1.5 mm Ca2+ and under low Ca2+ conditions with 1 mm Ca2+ in the recording pipette solution. Note that even at extremely high intensities of 1.5 × 10⁷ EP/s under low Ca2+ conditions the response amplitude of norpAH43 photoreceptors was very small. Inset, Intensity–response (logR–logI) relationship (n = 5, mean ± SEM). E, A representative light-induced response to 106 EP/s in norpAH43 mutant under low Ca2+, 1.5 mm Ca2+, and under low Ca2+ conditions with 1 mm Ca2+ in the recording pipette solution.
Figure 8.
Figure 8.
Group IIA divalent cations Mg2+, Sr2+, and Ba2+ do not induce dark bumps. A, Whole-cell recordings from WT photoreceptors at total darkness at the various conditions as indicated. Note that only Ca2+ induced dark bump activity. B, Histogram plotting the mean bump rate of dark bumps at the different conditions (n = 4, mean ± SEM). C, Light response to 1EP/s intensity. Note that in all cases bumps can be induced by the light stimuli. D, Histogram plotting the mean bump rate of light-induced bumps at the different conditions (n = 4, mean ± SEM).
Figure 9.
Figure 9.
Bump kinetics is independent of PLC catalytic activity. A, Whole-cell recordings from WT photoreceptors in total darkness (top trace), light-induced bumps in WT in response to light intensity of 1 EP/s (middle trace) and light-induced bumps in norpAH43 mutant flies in response to light intensity of 10 EP/s (bottom trace). B, Histogram plotting the time to peak (tp) distribution of WT dark bumps, WT quantum bumps, and norpAH43 quantum bumps (n = 118). Inset left, Gaussian fits to the tp distribution histograms (mean tp; WT dark = 14.6 ms, WT light = 16.4 ms and norpAH43 light = 16.8 ms). Inset right, Normalized average of 118 bumps from traces in A (tp; WT dark = 14.7 ms, WT light = 16.4 ms and norpAH43 light = 16.1 ms). C, Light response to a brief 50 ms flash at the various group IIA divalent cations solutions as indicated (arrows indicate the tp of the light response, tp; Low Ca2+ = 189 ms, 1.5 mm Ca2+ = 118 ms, 1.5 mm Mg2+ = 335 ms, 1.5 mm Sr2+ = 141 ms, and 1.5 mm Ba2+ = 128 ms). D, Normalized average of 100 bumps at the presence of various group IIA divalent cations solutions as indicated (arrows indicate the tp of the averaged quantum bump, tp; Low Ca2+ = 71.5 ms, 1.5 mm Ca2+ = 16 ms, 1.5 mm Sr2+ = 25.7 ms, 1.5 mm Ba2+ = 30.6 ms and 1.5 mm Ca2+ + 4 mm Mg2+ = 17.2 ms).

Similar articles

Cited by

References

    1. Barash S, Minke B. Is the receptor potential of fly photoreceptors a summation of single-photon responses? Comments Theoretical Biology. 1994;3:229–263.
    1. Bloomquist BT, Shortridge RD, Schneuwly S, Perdew M, Montell C, Steller H, Rubin G, Pak WL. Isolation of a putative phospholipase C gene of Drosophila, norpA, and its role in phototransduction. Cell. 1988;54:723–733. - PubMed
    1. Chyb S, Raghu P, Hardie RC. Polyunsaturated fatty acids activate the Drosophila light-sensitive channels TRP and TRPL. Nature. 1999;397:255–259. - PubMed
    1. Cook B, Bar-Yaacov M, Cohen Ben-Ami H, Goldstein RE, Paroush Z, Selinger Z, Minke B. Phospholipase C and termination of G-protein-mediated signalling in vivo. Nat Cell Biol. 2000;2:296–301. - PubMed
    1. Delgado R, Bacigalupo J. Unitary recordings of TRP and TRPL channels from isolated Drosophila retinal photoreceptor rhabdomeres: activation by light and lipids. J Neurophysiol. 2009;101:2372–2379. - PubMed

Publication types

MeSH terms

LinkOut - more resources