. 2012 Feb 22;32(8):2734-46.
doi: 10.1523/JNEUROSCI.5780-11.2012.

Transient extracellular glutamate events in the basolateral amygdala track reward-seeking actions

Affiliations

Transient extracellular glutamate events in the basolateral amygdala track reward-seeking actions

Kate M Wassum et al. J Neurosci. .

Abstract

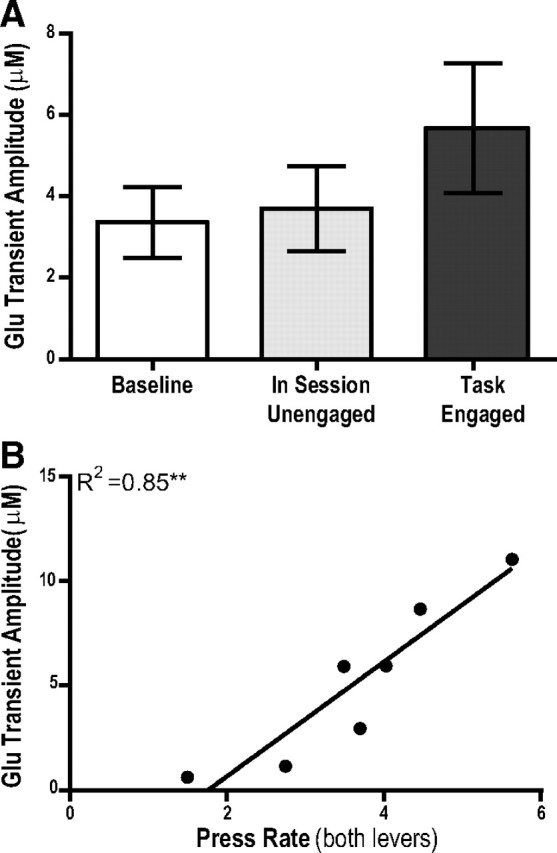
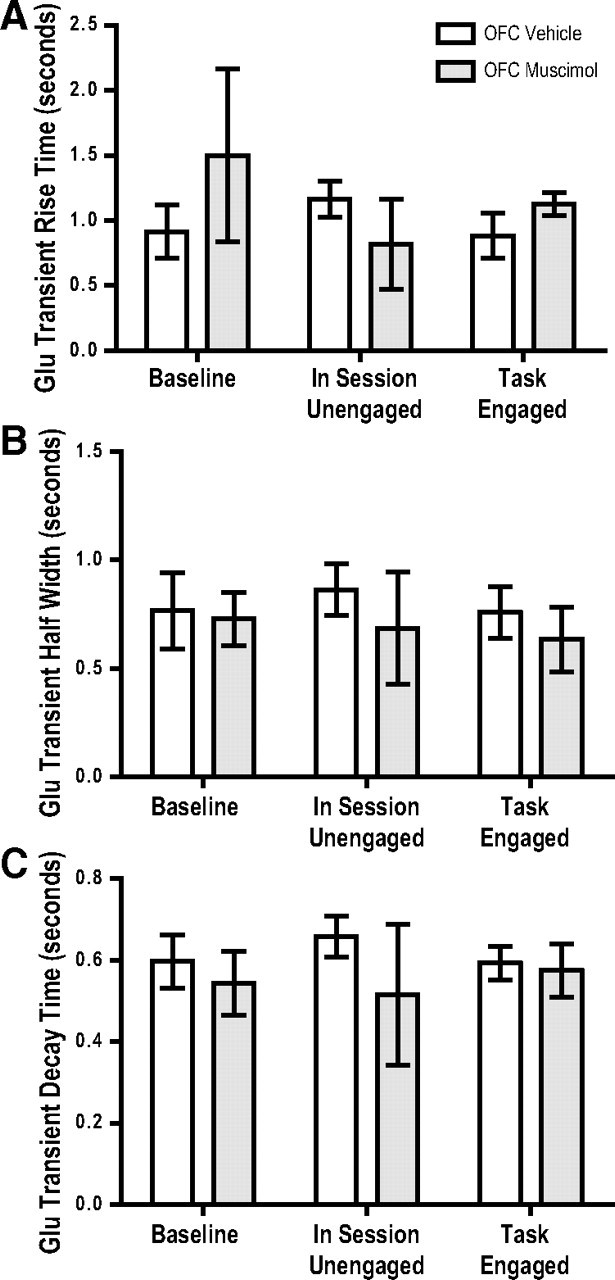
The ability to make rapid, informed decisions about whether or not to engage in a sequence of actions to earn reward is essential for survival. Modeling in rodents has demonstrated a critical role for the basolateral amygdala (BLA) in such reward-seeking actions, but the precise neurochemical underpinnings are not well understood. Taking advantage of recent advancements in biosensor technologies, we made spatially discrete near-real-time extracellular recordings of the major excitatory transmitter, glutamate, in the BLA of rats performing a self-paced lever-pressing sequence task for sucrose reward. This allowed us to detect rapid transient fluctuations in extracellular BLA glutamate time-locked to action performance. These glutamate transients tended to precede lever-pressing actions and were markedly increased in frequency when rats were engaged in such reward-seeking actions. Based on muscimol and tetrodotoxin microinfusions, these glutamate transients appeared to originate from the terminals of neurons with cell bodies in the orbital frontal cortex. Importantly, glutamate transient amplitude and frequency fluctuated with the value of the earned reward and positively predicted lever-pressing rate. Such novel rapid glutamate recordings during instrumental performance identify a role for glutamatergic signaling within the BLA in instrumental reward-seeking actions.


Figures

Figure 1.
Figure 1.
Micromachined silicon-based platinum microelectrode array biosensors for near-real time glutamate detection. A, Scanning electron micrograph image of the tip of the silicon-based probe showing the platinum (Pt) electrode array. The probes were insulated with silicon oxide. B, Schematic representation of the coatings for glutamate biosensing. GluOx is a flavoenzyme that catalyzes the oxidative deamination of glutamate through its flavin adenine dinucleotide (FAD) cofactor, a by-product of which is hydrogen peroxide (H2O2). Electrooxidation (at a potential of −0.7 V vs an Ag/AgCl reference electrode) of the enzymatically generated H2O2 at the surface of the platinum electrode provides a recordable current signal that, through an in vitro calibration factor, can be converted into glutamate concentration. Anions, such as ascorbic acid (AA), are excluded by application of a thin layer of Nafion, while cations, such as dopamine (DA), are repelled from the platinum electrode surface by an electrochemically deposited layer of polypyrrole (PPY).
Figure 2.
Figure 2.
Schematic representation of the placement of MEA biosensor tips and injectors. Line drawings of coronal sections are taken from Paxinos and Watson (1998). Numbers to the bottom right of each section represent the anterior–posterior distance (in millimeters) from bregma of the section. A, The recording tip of the MEA placement for rats in which only the biosensor was implanted in the BLA. Representation is relatively scaled to the coronal line section. B, OFC injector placements along with MEA recording tip placement in the BLA. C, Recording tip of the MEA with attached guide and injector placement for TTX/vehicle infusion in the BLA.
Figure 3.
Figure 3.
Representative example of transient glutamate concentration changes in the basolateral amygdala. After a 3 min baseline period in the operant chamber, rats were allowed to respond on the sequence of actions to earn sucrose pellet rewards while current changes at both the glutamate biosensor and control electrodes were recorded. The lever-pressing session started at time 0. The light gray triangles reflect distal lever presses, while the dark gray triangles indicate the time of proximal lever presses. A, Current changes recorded from the glutamate biosensor (black line) and control electrode (gray line) were subtracted from the baseline current (average of the 10 s 3 min before the beginning of the lever-pressing test). B, The dashed box of A is expanded to show a 5 min time frame from the lever-pressing session and clarify the rapid changes detected on the glutamate biosensor output. C, Current changes from baseline on the control electrode were subtracted from current changes from baseline on the glutamate biosensing electrode to provide the extracellular glutamate measurement. D, BLA glutamate transient events (black bars) were counted (see Materials and Methods) over the test session. The time of each event is plotted on the x-axis, with transient amplitude plotted on the y-axis. E, F, Task-related BLA glutamate concentration changes. Preevent background (average of 10–8 s before distal lever press) subtracted signals from the control electrode were subtracted from the glutamate biosensor signal and time-locked to either the distal (E) or proximal (F) lever press action. Resulting glutamate concentration changes were averaged within each rat (∼30 trials), and then across rats (N = 7). The arrows above the x-axis indicate the range of the average time (across events within each rat) at which the following proximal (E) or preceding distal (F) lever press occurred, such that peaks occurring above these arrows reflect glutamate concentration changes associated with the preceding or following event. The gray bar (E) marks the 5 s period after the proximal action that coincided with delivery and consumption of the sucrose pellet. The dashed line indicates +1 SEM.
Figure 4.
Figure 4.
Representative examples of individual basolateral amygdala glutamate concentration transients. Current changes from baseline on the control electrode were subtracted from current changes from baseline on the glutamate biosensing electrode to provide the extracellular glutamate measurement. Time in seconds on the x-axis reflects the actual time in the test session from which the transient was extracted, with the lever-pressing test starting at 0 s. A, Representative 20 s time bin from the behavioral session of a single rat showing two glutamate concentration transients. Rise time is calculated as the time from baseline to the peak amplitude of the transient, marked with an “X.” The amplitude is calculated as the peak amplitude of the transient minus the baseline. Decay time is calculated as the time from the peak amplitude to 37% of the peak amplitude and t1/2 is the width of the peak at one-half of the amplitude. B, C, Representative transients from two separate animals on a shorter 7 s timescale. B shows a spontaneous transient from the baseline period. D, On some occasions, transients were longer in duration as is shown in this representative transient.
Figure 5.
Figure 5.
Basolateral amygdala glutamate transient frequency is increased during lever-pressing activity. A, BLA glutamate transient events that reached threshold were counted for the entire test session and then averaged for each rat across the 3 min pre-lever-pressing test baseline period (baseline), during the lever-pressing session when rats were unengaged in the task (in session unengaged), and when rats were engaged in lever pressing (task-engaged). This was then averaged across rats to show that glutamate transient frequency (glutamate transients/minute) was increased when rats were engaged in lever pressing. B, The total number of lever presses (combining both distal and proximal presses) in the 10 s before and after all glutamate transient events were summed for each rat and grouped into 1 s bins (x-axis), and then averaged across rats to result in a peri-transient lever press histogram. The dashed line indicates +1 SEM. C, BLA glutamate transient frequency was averaged across the lever-pressing session for each rat (including both the unengaged and task-engaged phases), and this was correlated with each rat's average lever press rate (on both levers). N = 7. Error bars indicate ±1 SEM. *p < 0.05; **p < 0.01; ***p < 0.001.
Figure 6.
Figure 6.
Basolateral amygdala glutamate transient amplitude is associated with lever-pressing activity. A, The amplitude (micromolar) of each glutamate transient event was averaged across the 3 min pre-lever-pressing test baseline period (baseline), during the lever-pressing session when rats were unengaged in the task (in session unengaged), and when rats were engaged in lever pressing (task-engaged). This was then averaged across rats. B, BLA glutamate transient amplitude was average across the lever-pressing session for each rat (including both the unengaged and task-engaged phases), and this was correlated with each rat's average lever press rate (on both levers). N = 7. Error bars indicate ±1 SEM. **p < 0.01.
Figure 7.
Figure 7.
Specific satiety reward devaluation results in a reduction in lever-pressing rate and a concomitant reduction in task-related basolateral amygdala glutamate transient frequency and overall glutamate transient amplitude. A, Effect of specific satiety outcome devaluation on lever-pressing activity. Rats receiving the specific satiety treatment (shaded bars) showed lower distal and proximal response rates (normalized to presatiety baseline levels) than unsated controls (open bars). B, Average BLA glutamate (glu) transient frequency before the behavioral session (baseline) and during the session, separated into unengaged and task-engaged phases. Glutamate transient frequency is increased when rats are engaged in the lever-pressing task, and this effect is blocked in rats receiving the specific satiety devaluation treatment. C, Effect of specific satiety on the average glutamate transient amplitude (micromolar). N = 4 per group. Error bars indicate ±1 SEM. **p < 0.01.
Figure 8.
Figure 8.
TTX attenuates baseline BLA glutamate transient frequency. TTX (shaded bars) infused locally into the region around the MEA sensor attenuated the frequency of glutamate transients in freely moving rats relative to vehicle infusion (open bars). Rats were not engaged in a lever-pressing task. N = 4. Error bars indicate ±1 SEM. *p < 0.05.
Figure 9.
Figure 9.
Orbitofrontal cortex inactivation attenuates basolateral amygdala glutamate transients. A, Ipsilateral intra-OFC muscimol infusion (shaded bars) did not impact press rate on either the distal or proximal lever. B, Infusion of muscimol into the OFC decreased the frequency of glutamate (glu) transients when rats were engaged in the behavioral task relative to vehicle infusion (open bars), but did not significantly alter glutamate transient frequency before the behavioral session or when rats were unengaged in lever pressing. C, Glutamate transient amplitude (micromolar) was not significantly affected by intra-OFC muscimol infusion. N = 4. Error bars indicate ±1 SEM. **p < 0.01.
Figure 10.
Figure 10.
Dynamics of basolateral amygdala glutamate transients are unaltered by orbitofrontal cortex inactivation. A, Glutamate (Glu) transient rise time (seconds) was not affected by either test phase or intra-OFC drug. B, Glutamate transient half-width (seconds) was also not affected by either test phase or intra-OFC drug. C, Glutamate transient decay time (seconds) was unaffected by either test phase or intra-OFC drug. N = 4. Error bars indicate ±1 SEM.

Similar articles

Cited by

References

    1. Baker DA, Xi ZX, Shen H, Swanson CJ, Kalivas PW. The origin and neuronal function of in vivo nonsynaptic glutamate. J Neurosci. 2002;22:9134–9141. - PMC - PubMed
    1. Balleine BW, Dickinson A. The effect of lesions of the insular cortex on instrumental conditioning: evidence for a role in incentive memory. J Neurosci. 2000;20:8954–8964. - PMC - PubMed
    1. Balleine BW, Killcross AS, Dickinson A. The effect of lesions of the basolateral amygdala on instrumental conditioning. J Neurosci. 2003;23:666–675. - PMC - PubMed
    1. Balleine B, Paredes-Olay C, Dickinson A. Effects of outcome devaluation on the performance of a heterogeneous instrumental chain. Int J Comp Psychol. 2005;18:257–272.
    1. Belay A, Collins A, Ruzgas T, Kissinger PT, Gorton L, Csöregi E. Redox hydrogel based bienzyme electrode for l-glutamate monitoring. J Pharm Biomed Anal. 1999;19:93–105. - PubMed

Publication types

MeSH terms

LinkOut - more resources