. 2012 Feb 22;32(8):2747-61.
doi: 10.1523/JNEUROSCI.5135-11.2012.

Memory-guided sensory comparisons in the prefrontal cortex: contribution of putative pyramidal cells and interneurons

Affiliations

Memory-guided sensory comparisons in the prefrontal cortex: contribution of putative pyramidal cells and interneurons

Cory R Hussar et al. J Neurosci. .

Abstract

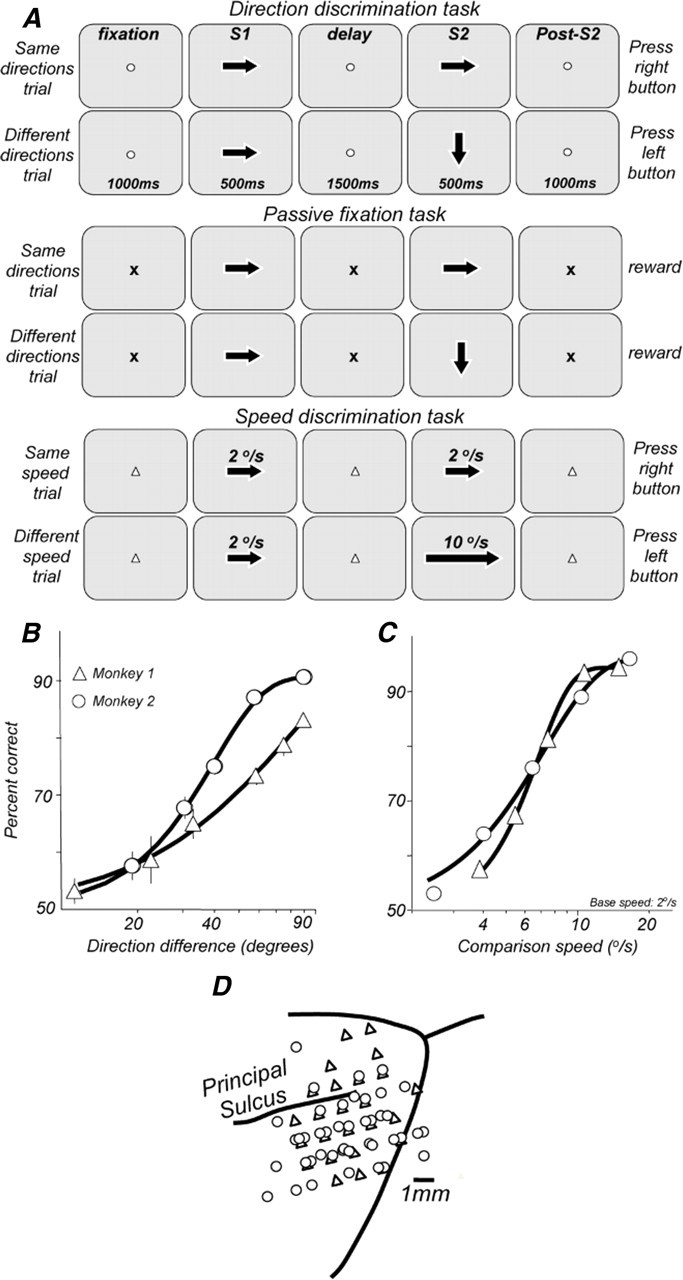
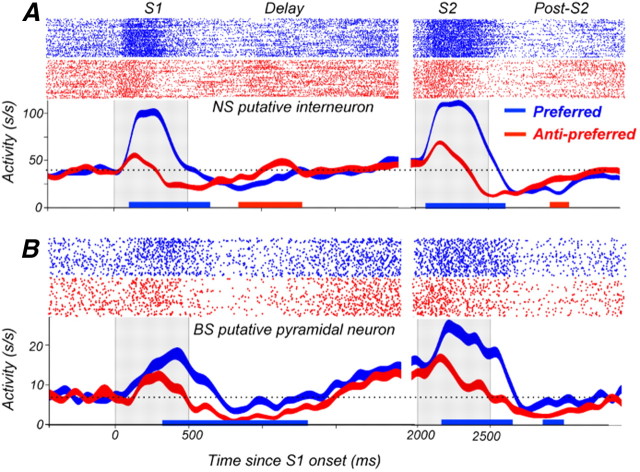
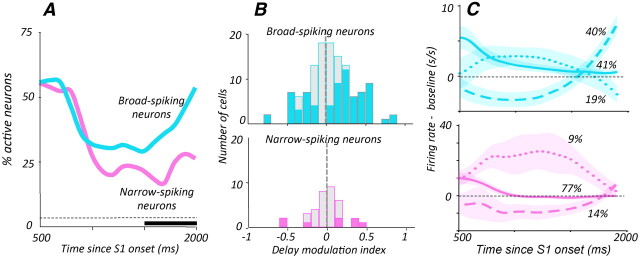
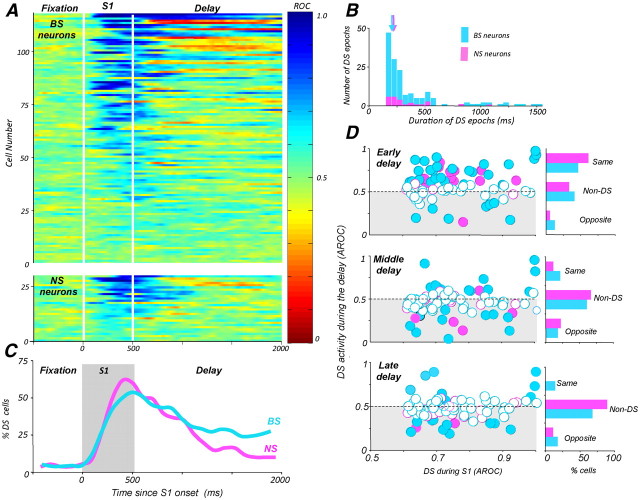
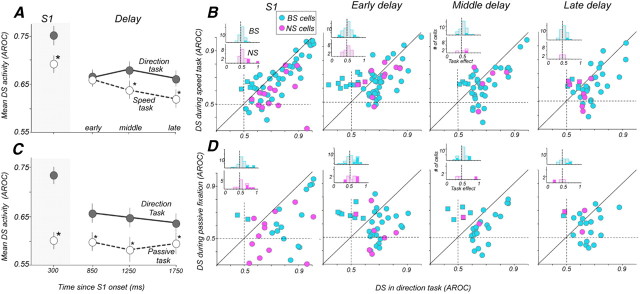
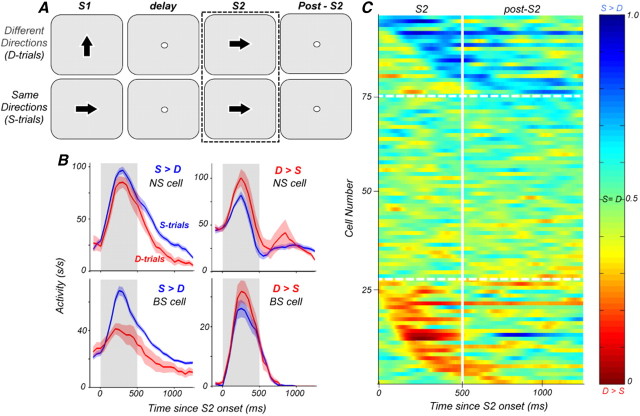
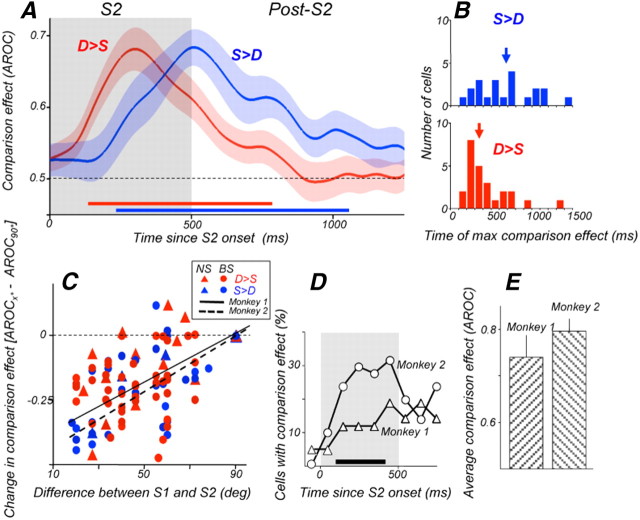
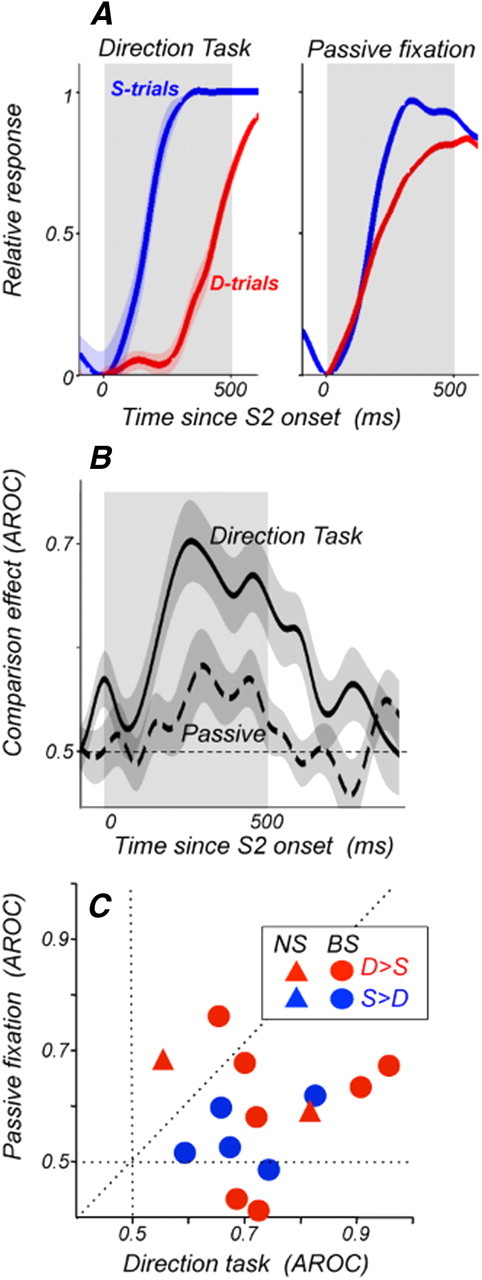
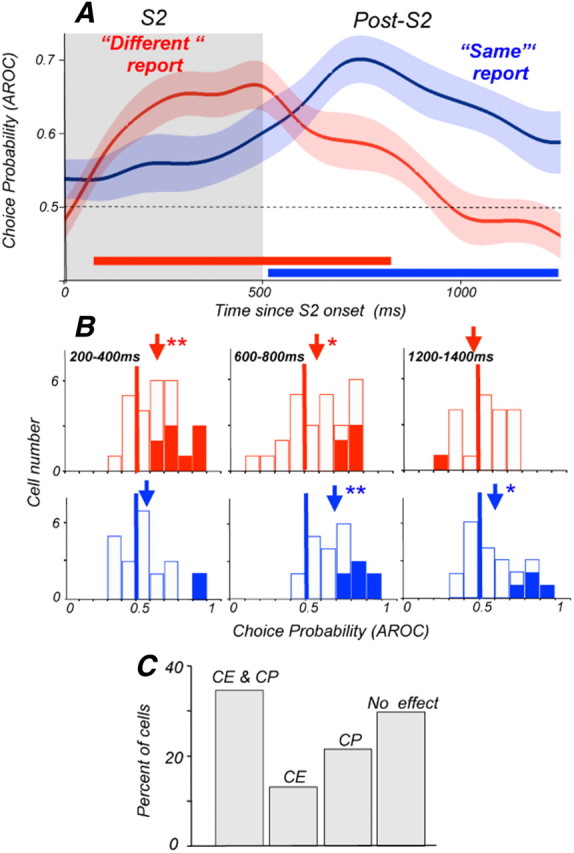
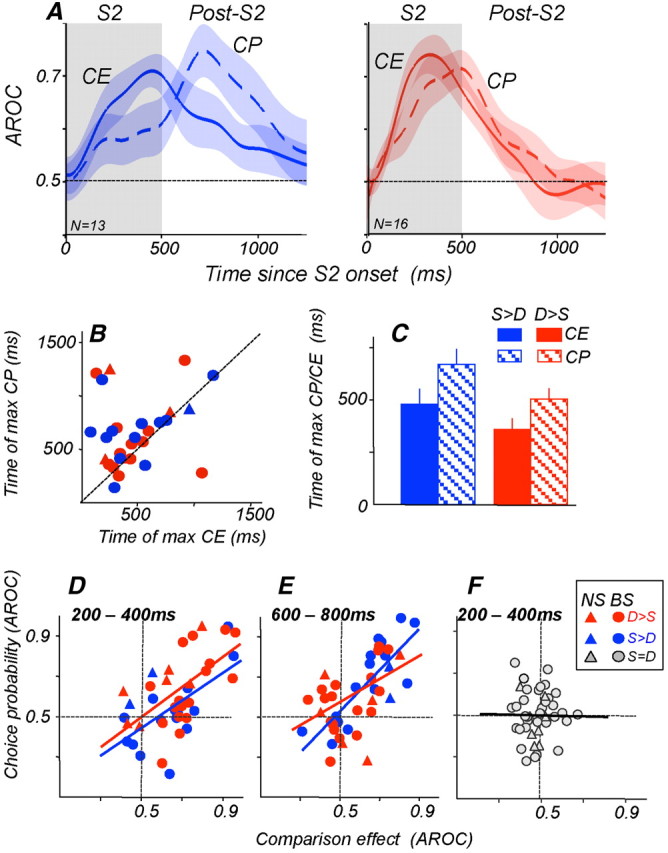
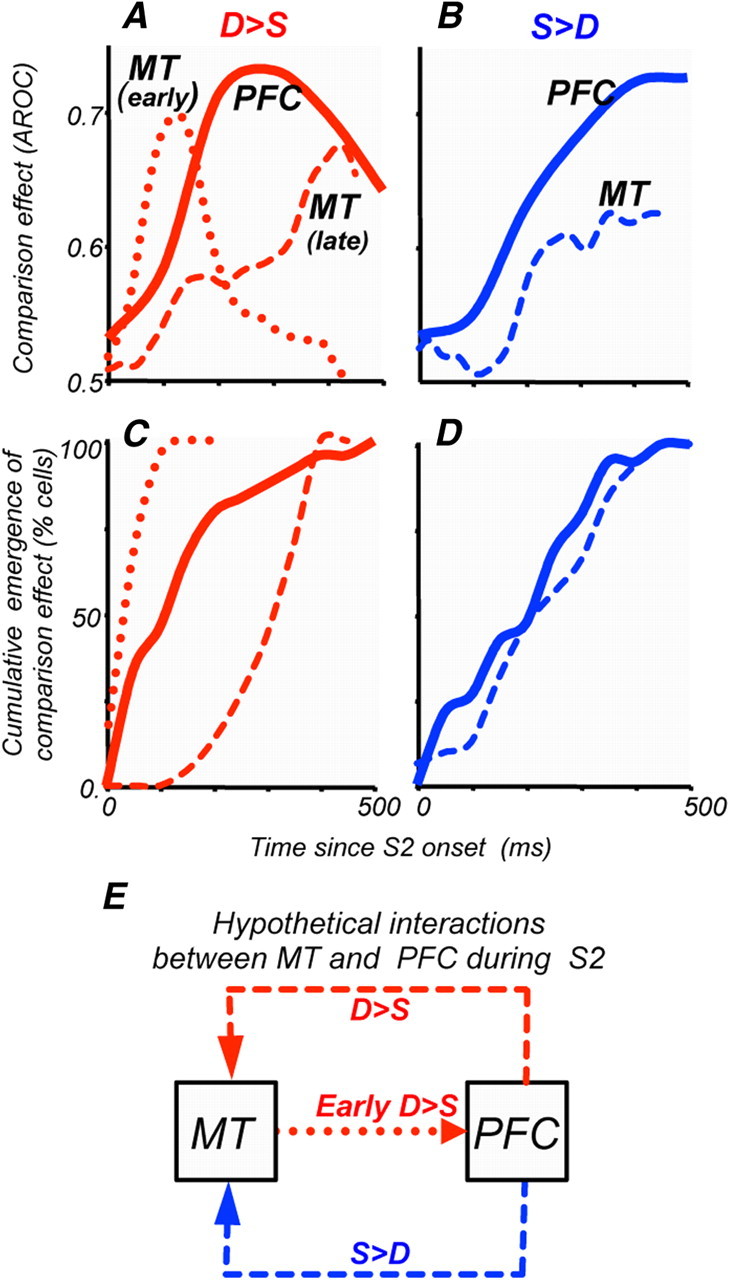
Comparing two stimuli that occur at different times demands the coordination of bottom-up and top-down processes. It has been hypothesized that the dorsolateral prefrontal (PFC) cortex, the likely source of top-down cortical influences, plays a key role in such tasks, contributing to both maintenance and sensory comparisons. We examined this hypothesis by recording from the PFC of monkeys comparing directions of two moving stimuli, S1 and S2, separated by a memory delay. We determined the contribution of the two principal cell types to these processes by classifying neurons into broad-spiking (BS) putative pyramidal cells and narrow-spiking (NS) putative local interneurons. During the delay, BS cells were more likely to exhibit anticipatory modulation and represent the remembered direction. While this representation was transient, appearing at different times in different neurons, it weakened when direction was not task relevant, suggesting its utility. During S2, both putative cell types showed comparison-related activity modulations. These modulations were of two types, each carried by different neurons, which either preferred trials with stimuli moving in the same direction or trials with stimuli of different directions. These comparison effects were strongly correlated with choice, suggesting their role in circuitry underlying decision making. These results provide the first demonstration of distinct contributions made by principal cell types to memory-guided perceptual decisions. During sensory stimulation both cell types represent behaviorally relevant stimulus features contributing to comparison and decision-related activity. However in the absence of sensory stimulation, putative pyramidal cells dominated, carrying information about the elapsed time and the preceding direction.


Figures

Figure 1.
Figure 1.
Behavioral tasks, performance, PFC recording sites. A, Diagrams of behavioral tasks. During the direction discrimination task (top row), animals reported whether the directions of two consecutive random-dot motion stimuli were the same or different by pressing one of two response buttons. The animals were allowed to respond 1000 ms after the termination of S2. During each session, direction difference thresholds were measured by varying the difference between directions in S1 and S2. During the passive fixation task (middle row), stimulus conditions and the timing matched those of the direction task, but the animals were only required to maintain fixation throughout the trial and automatically received a reward. During the speed discrimination task (bottom row), the monkeys reported whether two stimuli moved at the same or different speeds. On each trial the two stimuli always moved in the same direction. During each session, speed difference thresholds were measured by varying the differences between S1 and S2. B, Mean psychometric functions for the two monkeys measured during the direction discrimination task. Each function is based on data collected during 159 sessions, each consisting of 150–300 trials C, Representative psychometric functions for the two monkeys measured during a single session of 300 trials during the speed discrimination task. D, Locations of electrode penetrations for all PFC recordings for the two monkeys. Symbols indicating penetrations for each animal are the same as those used to show their individual behavioral performance (see B and C).
Figure 2.
Figure 2.
Activity of two example neurons during the direction comparison task Raster plots and average activity for an example NS putative interneuron (A) and BS putative pyramidal neuron (B). Activity from trials with the S1 and S2 stimuli moving in a neuron's preferred and antipreferred directions are indicated by blue and red colors, respectively. Because directions often differed between S1 and S2, trials before S2 onset were selected based on the S1 direction, while trials after S2 onset were selected based on the S2 direction. Periods of significantly higher activity following S1 moving in preferred and antipreferred directions are indicated by blue and red lines, respectively, plotted along the x-axis (Wilcoxon sign-rank, p < 0.05).
Figure 3.
Figure 3.
Broad-spiking neurons show anticipatory delay modulation A, Incidence of NS (n = 35) and BS (n = 124) neurons active (relative to baseline) during the delay. The thick black line signifies the period of significant difference between NS and BS (χ2 test, p < 0.05). The dashed line at 5% represents significance level expected by chance. B, Time-dependent modulation of delay activity for BS (top) and NS (bottom) neurons. Delay modulation index (DMI) = [activity (late delay) − activity (middle delay)]/[activity (late delay) + activity (middle delay)]; “late delay”, last 200 ms of delay; “middle delay”, 200 ms period centered at 1250 ms. DMI > 0 indicate higher activity in late delay relative to middle delay; DMI < 0 indicate lower activity in late delay. Filled colored columns, cells with significant indices (Wilcoxon sign-rank test, p < 0.01); gray columns, cells with nonsignificant values. C, Average activity of BS (top) and NS (bottom) of neurons classified on the basis of their DMI as cells with rising activity (broken lines), cells with decreasing activity (dotted lines), and cells with no activity modulation (solid lines). The numbers next to each curve show the incidence of each cell group.
Figure 4.
Figure 4.
Direction-selective delay activity. A, DS activity during the trial (fixation, S1 and delay) for individual BS (N = 124, top) and NS (N = 35, bottom) neurons quantified by ROC analysis. Scale bar shows ROC values: blue, preferred; red, antipreferred direction. The data were sorted by the average selectivity. B, Durations of DS epochs during the delay. Small arrows point to the average duration of DS delay epochs for each cell type (NS, 245 ms; BS, 242 ms). C, Incidence of BS and NS neurons with significant DS (Wilcoxon sign-rank test, p < 0.05). D, Relationship between DS preferences recorded during S1 and during the delay. Only cells with significant DS activity during S1 were used (NS, n = 18; BS, n = 56). AROC values computed for each neuron during S1 are plotted against the values computed in early (500–1000 ms), middle (1000–1500 ms), and late (1500–2000 ms) delay. DS during the delay is shown by open (p > 0.05) and filled (p < 0.05) light blue (BS) or pink (NS) circles. AROC values of >0.5 represent DS of the same sign as that of S1, while AROC values of <0.5 represents DS opposite in sign to S1. Bar plots to the right are summaries showing the incidence of BS and NS neurons with DS of the same sign (top bars) or opposite sign (bottom bars) as during S1. Middle bars show the incidence of neurons with no DS activity during each delay epoch.
Figure 5.
Figure 5.
Direction-selective delay activity was affected by task demands. A, Average DS activity during direction and speed tasks recorded during three consecutive task periods: S1 (200–400 ms), early delay (700–1000 ms), middle delay (1000–1500 ms), and late delay (1500–2000 ms). For each epoch the data were calculated for all neurons with significant DS activity (p < 0.05, Wilcoxon sign rank test) in either task. Asterisk (*) indicates significant difference between tasks (p < 0.05, Wilcoxon sign rank test). B, DS activity (AROC) of individual neurons during the direction and the speed discrimination tasks recorded during the early, middle, and late delays. All BS (n = 87) and NS (n = 25) neurons were evaluated for significant DS activity in each task during each time period. Neurons with significant DS in the direction task (circles) and neurons with significant DS only during the speed task (squares) are shown separately. Insets in the upper left corner show distributions of task effects (TEs) computed as [AROCdirecton task − AROCnon-direction task] for all neurons. Neurons with significant TEs are shown by filled columns (bootstrap test, p < 0.05). C, D, DS activity (AROC) during the direction and the passive fixation tasks. BS (n = 57) and NS cells (n = 16) were evaluated for DS activity during each time period. Conventions and labels are the same as in A and B.
Figure 6.
Figure 6.
Comparison effects (CE) during S2. A, Diagram illustrating the two types of trials used to evaluate CE, S-trials (same), and D-trials (different). B, Example responses during S2 of two NS (top row) and two BS (bottom row) neurons showing the two types of modulation by S1 direction. The two neurons on the left fired more on S-trials (S > D, blue lines), while the two neurons on the right responded more on D-trials (D > S, red lines). Note that both NS and BS cells showed such effects. C, CE in all neurons quantified with ROC analysis (BS, n = 76; NS, n = 18). AROC values > 0.5 (cooler colors) signify higher activity on S-trials, and AROC values < 0.5 (warmer colors) signify stronger activity on D-trials. Neurons were sorted by timing and sign of their comparison effects. Note, S and D trials are signaled by different groups of cells, S > D (blue) and D > S (red).
Figure 7.
Figure 7.
Comparison effects (CEs) recorded during and after S2. A, Average CE for S > D cells (blue, n = 20) and D > S cells (red, n = 26) during S2 and post-S2. Shadings represent ± SEM. B, Times of maximal CE for S > D (top) and D > S (bottom) neurons. CE reached its maximum earlier in D > S neurons (340 ms vs 690 ms; Mann–Whitney U test, p = 0.01). C, Dependence of CE on the difference in direction between S1 and S2: D > S (red); S > D cells (blue); NS (n = 10), BS (n = 36). The change in CE for each direction difference was computed by subtracting its value from CE measured for 90° difference (AROCx° − AROC90°).Values < 0 correspond to a decrease in the effect relative to CE measured at 90°. Correlation between CE and direction difference was significant for both animals (shown by separately for each monkey; monkey 1: p = 7.5 × 10⁻⁶, solid line; monkey 2: p = 2.1 × 10⁻¹⁴, broken line). D, Incidence of significant CE encountered in the two monkeys. Thick black bar along the x-axis denotes period of significant difference between animals (χ2 S2, p < 0.05). E, Comparison of average CE between animals calculated for cells with significant CEs only during 200–500 ms period after S2 onset (Monkey 1, n = 6; Monkey 2, n = 20). The difference in the magnitude of CE between the two monkeys did not reach statistical significance (p = 0.13, Mann–Whitney U test).
Figure 8.
Figure 8.
Attenuation of comparison effects during passive fixation. A, Relative responses to S2 on S- and D-trials of an example neuron recorded during the direction (left) and passive fixation (right) tasks. B, Average comparison effects recorded during the two tasks (NS = 2, BS = 12). C, Cell-by-cell comparison effects measured during the direction task and passive fixation. The data represent activity recorded during 100–300 ms after the onset of S2. Comparison effects were weaker during the passive task (Wilcoxon sign-rank test, p = 0.004).
Figure 9.
Figure 9.
Activity during S2 predicts perceptual report. A, Choice probability of neurons more active before “different” (n = 24) and before “same” (n = 17) reports. Thick colored lines along the x-axis indicate period of significance (Mann–Whitney U test, p < 0.05). Shadings represent ± SEM. B, Distributions of CPs for neurons contributing to CP curves shown in A. Distribution of CPs during 200–400 ms, 600–800 ms, and 1200–1400 ms after the onset of S2. Arrows point to mean CPs for each period; *p <0.05; **p < 0.01. C, Incidence of CE and CP signals co-occurring in the same neurons (CP and CE, n = 29; CE only, n = 11; CP only, n = 18; no effect, n = 25).
Figure 10.
Figure 10.
Comparison effects (CEs) and choice-related (CP) signals. A, Time course of CE and CP in S > D neurons (n = 13, blue plots) and D>S neurons (n = 16, red plots). B, Relationship between times of maximal CP and CE for individual neurons. C, Average times of maximal CP and CE. CE preceded CP by 145 ms in D > S cells (p = 0.006, Wilcoxon sign-rank test) and by 190 ms in S > D cells (p = 0.012, Wilcoxon sign-rank test). DE, Correlation between CE and CP for individual S > D and D > S cells at 200–400 ms (D, S > D, p = 0.009; D > S, p = 0.002) and at 600–800 ms (E, S > D, p = 1.2 × 10⁻⁴; D > S, p = 0.03) after S2 onset. F, Neurons with no CE (S = D) showed no correlation between CE and CP (p = 0.979).
Figure 11.
Figure 11.
Comparison effects in PFC and MT. Comparison effects during S2 recorded in the PFC and in MT. MT data are replotted from Lui and Pasternak (2011). A, CE for D > S cells in PFC (solid line) and two subpopulations of D > S cells in MT, early (dotted line) and late (broken line) identified in MT. B, CE for S > D cells in PFC (solid line) and MT (broken line). C, D, Cumulative emergence of comparison effects in MT and PFC. Conventions and labels are identical to A and B. E, Hypothetical interactions between MT and PFC during S2.

Similar articles

Cited by

References

    1. Ardid S, Wang XJ, Compte A. An integrated microcircuit model of attentional processing in the neocortex. J Neurosci. 2007;27:8486–8495. - PMC - PubMed
    1. Barak O, Tsodyks M, Romo R. Neuronal population coding of parametric working memory. J Neurosci. 2010;30:9424–9430. - PMC - PubMed
    1. Barbas H. Anatomic organization of basoventral and mediodorsal visual recipient prefrontal regions in the rhesus monkey. J Comp Neurol. 1988;276:313–342. - PubMed
    1. Britten KH, Shadlen MN, Newsome WT, Movshon JA. The analysis of visual motion: a comparison of neuronal and psychophysical performance. J Neurosci. 1992;12:4745–4765. - PMC - PubMed
    1. Britten KH, Newsome WT, Shadlen MN, Celebrini S, Movshon JA. A relationship between behavioral choice and the visual responses of neurons in macaque MT. Vis Neurosci. 1996;13:87–100. - PubMed

Publication types

MeSH terms