. 2012 Feb 22;32(8):2856-67.
doi: 10.1523/JNEUROSCI.4676-11.2012.

Reward action in the initiation of smooth pursuit eye movements

Affiliations

Reward action in the initiation of smooth pursuit eye movements

Mati Joshua et al. J Neurosci. .

Abstract

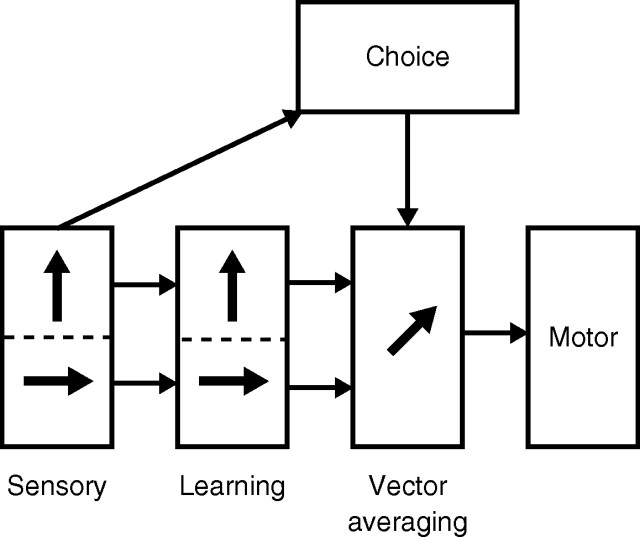
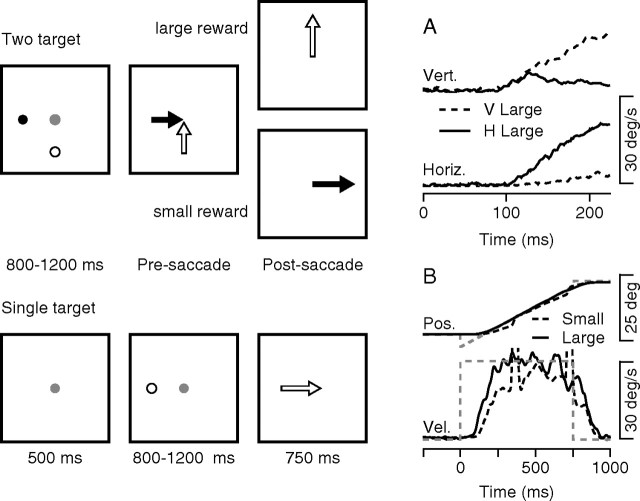
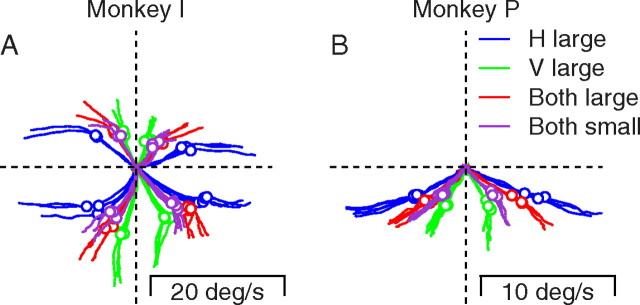
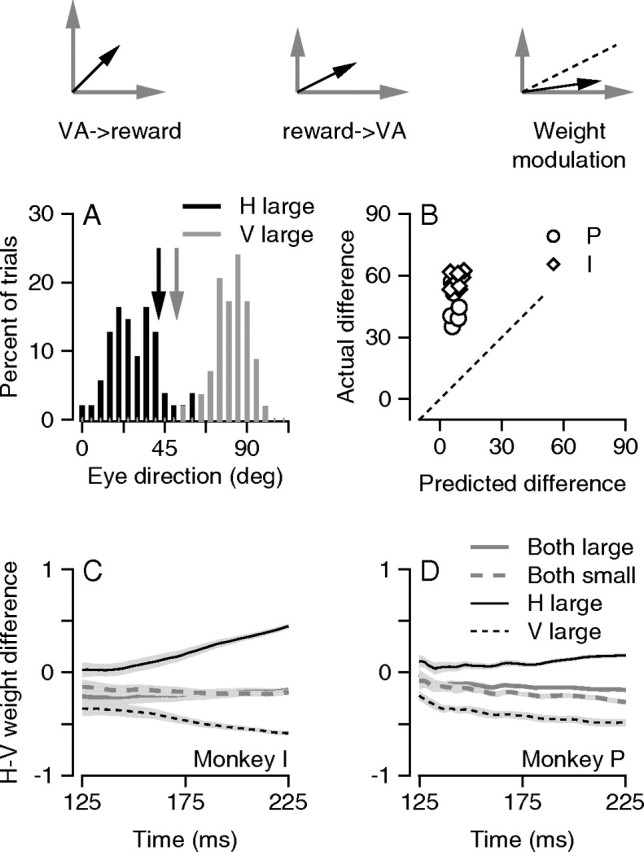
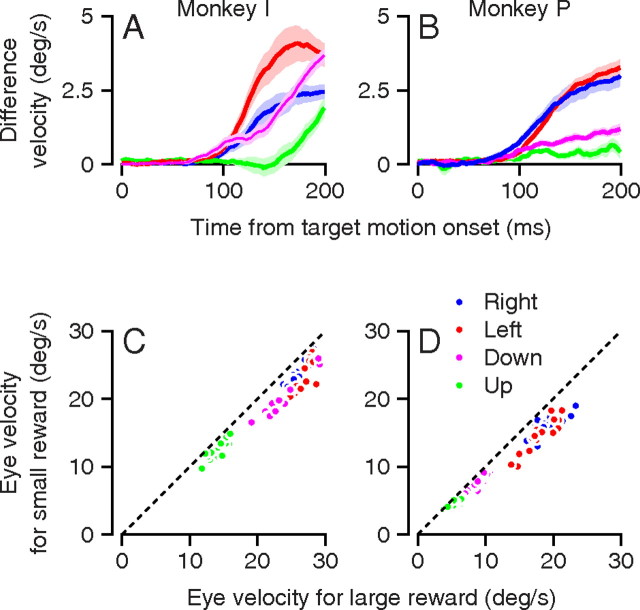
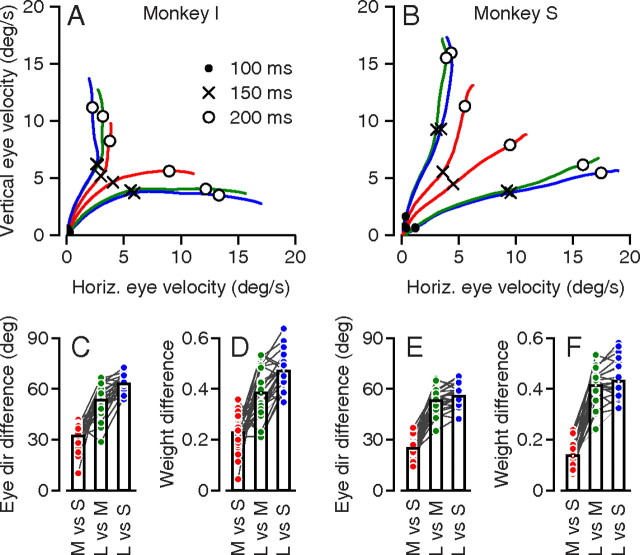
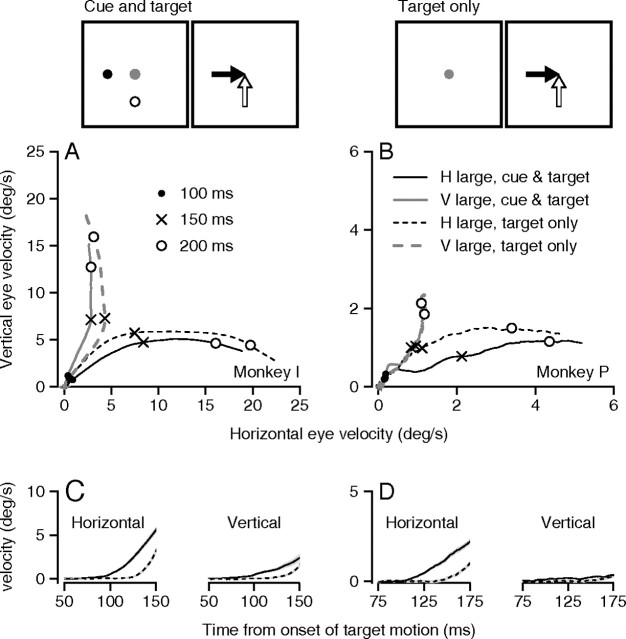
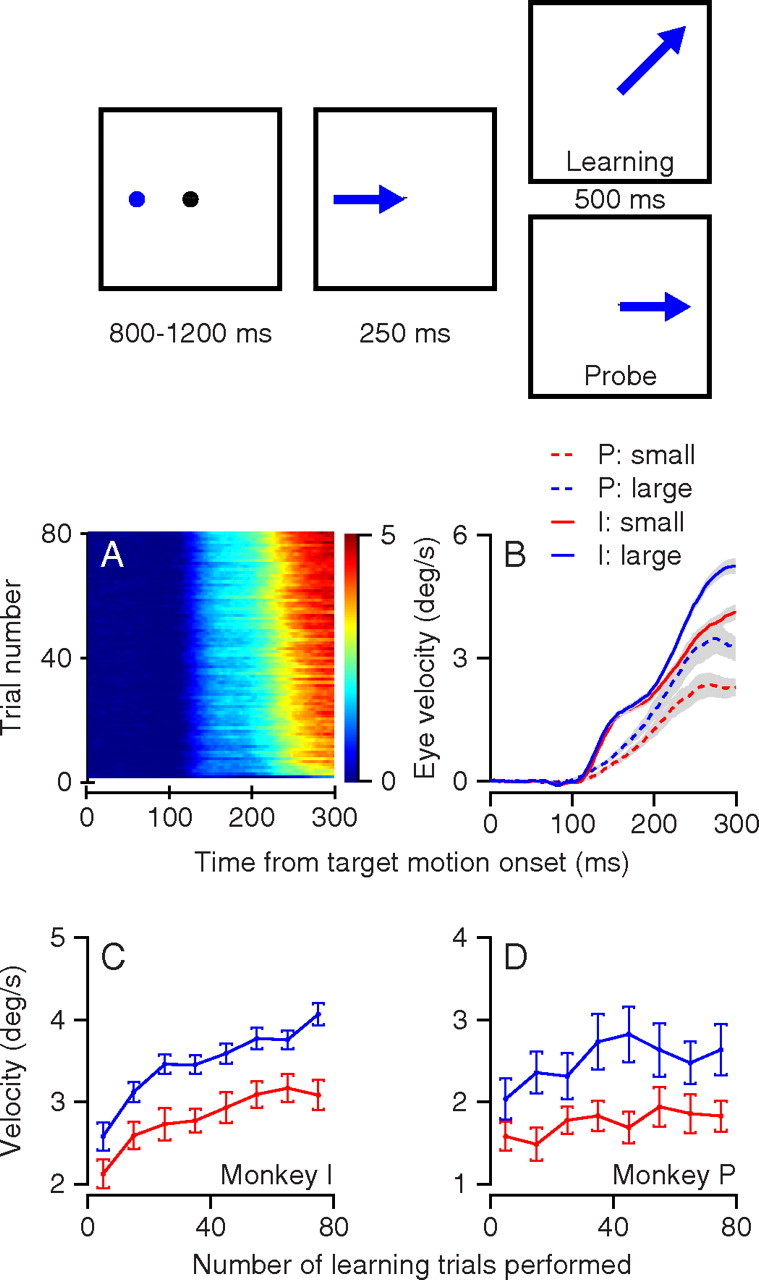
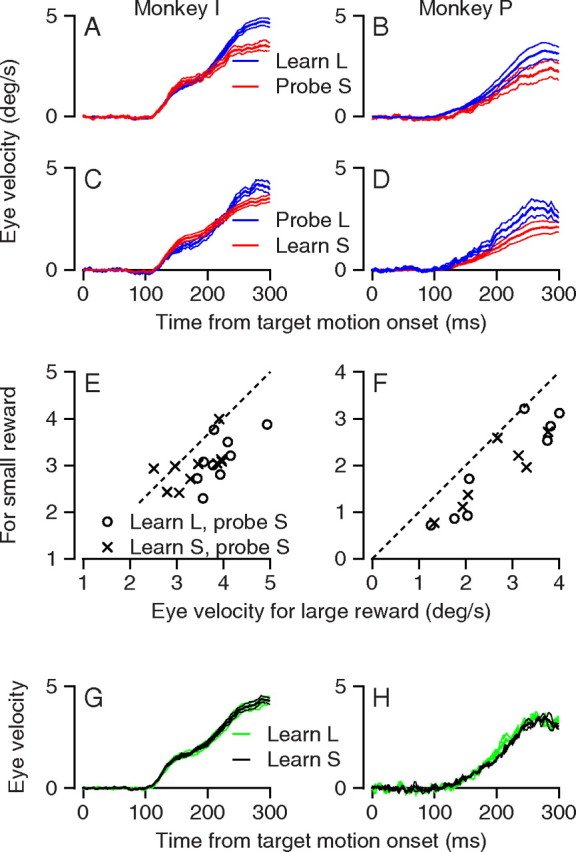
Reward has a powerful influence on motor behavior. To probe how and where reward systems alter motor behavior, we studied smooth pursuit eye movements in monkeys trained to associate the color of a visual cue with the size of the reward to be issued at the end of the target motion. When the tracking task presented two different colored targets that moved orthogonally, monkeys biased the initiation of pursuit toward the direction of motion of the target that led to larger reward. The bias was larger than expected given the modest effects of reward size on tracking of single targets. Experiments with three different reward sizes suggested that the bias afforded a given target depends mainly on the size of the larger reward. To analyze the effect of reward on directional learning in pursuit, monkeys tracked a single moving target that changed direction 250 ms after the onset of motion. Expectation of a larger reward led to a larger learned eye movement during the acquisition of the learned response and during subsequent probes of what had been learned, implying that reward influenced the expression rather than the acquisition of learning. The specific effects of reward size on learning and two-target stimuli imply that the site of reward modulation is at a level where multiple target motions compete for control of eye movement, downstream from sensory processing and learning and upstream from final motor processing.


Figures

Figure 1.
Figure 1.
Flow of information from sensory processing to final motor processing for smooth pursuit eye movements. The rectangular blocks represent different components of pursuit behavior, and the arrows between the boxes indicate the conceptual flow of information based on previous reports. The two arrows inside the boxes for sensory processing and learning indicate the existence of two parallel representations of two targets moving in different directions. The single arrow inside the box for vector averaging indicates the combination of multiple target motions to produce a single pursuit eye movement.
Figure 2.
Figure 2.
Example data showing the effect of reward size on the initiation of pursuit. The sequence of snapshots illustrates the structure of the behavioral task with two targets (top) or single targets (bottom). We show targets as filled and open spots for clarity of presentation, although they actually were green and yellow in our experiments. A, Examples of the horizontal (Horiz.) and vertical (Vert.) eye velocity in two different trials. The continuous and dashed traces show responses when the highly rewarded target moved horizontally or vertically. B, The black solid and dashed traces show examples of the horizontal eye position (Pos.) and velocity (Vel.) in trials that led to large or small rewards. The gray dashed lines are the target position and velocity.
Figure 3.
Figure 3.
The effect of reward size on the initiation of pursuit for two-target stimuli across multiple experiments. Each trace plots average vertical (V) eye velocity versus average horizontal (H) eye velocity for each millisecond in the first 200 ms after the onset of target motion. Different colors show data for different reward–size paradigms. Traces in different quadrants show responses for different pairs of orthogonal directions of target motions. The multiple traces of the same color show results from identical experiments performed on different days. A, B, the two graphs show data for two monkeys. Open circles on the traces show the eye velocities 150 ms after the onset of target motion. In monkey P we did not study the pursuit evoked by combinations of horizontal and upward target motion because pursuit was poor for the upward motion of single targets.
Figure 4.
Figure 4.
Evaluation of three models for the relative locations of vector averaging (VA) and reward modulation. The schematic diagrams at the top of the figure show the three models. Gray arrows show the responses to each target motion presented singly, modulated by reward size in the second and third models. Black arrows show the eye velocity predicted by each model. The dashed line shows the prediction of equally weighted vector averaging, which differs from the predicted eye velocity only in the third model. A, The distribution of eye direction 200 ms after target onset for 1 experimental day. Black and gray histograms indicate the results when the highly rewarded target moved horizontally (H; at 0°) or vertically (V; at 90°). The vertical arrows indicate the predictions for vector averaging of the appropriately rewarded targets presented singly. B, Comparison of the average direction of the initiation of pursuit in the data with the predictions for vector averaging of the appropriately rewarded targets presented singly. Each symbol shows data from a different experiment (n = 8 and 11 for monkeys P and I). Diamonds and circles represent data for monkeys I and P. The dashed line is the unity line. C, D, The difference between the weighting of the horizontal and vertical targets for two-target stimuli plotted as a function of time from the onset of target motion. Different line styles indicate different reward–size paradigms.
Figure 5.
Figure 5.
Quantitative analysis of the effect of reward size on the initiation of pursuit for single targets in two monkeys. A, B, Time course of the difference in the eye velocity during the initiation of pursuit between trials that led to large versus small rewards. Different colors indicate different directions of target motion, solid curves are the averages, and the lighter shading shows the SEM across experiments. Positive values indicate that eye velocity was larger in trials that led to large rewards. C, D, Scatter plots comparing the average velocity 200 ms after the onset of target motion for trials that led to small versus large rewards. Each point shows data for a single experimental day. Different colors correspond to the colors used to indicate different directions of target motion in A and B. The oblique dashed line indicates equal eye velocity for large versus small rewards; points that lie below the line indicate that eye velocity was smaller in trials that delivered smaller rewards. The number of sessions was 15 for monkey P in each direction and 16 and 17 sessions for the vertical and horizontal directions for monkey I.
Figure 6.
Figure 6.
Graded effects of different reward sizes. A, B, Two-dimensional plots for the two monkeys of average vertical eye velocity versus horizontal (Horiz.) eye velocity for each millisecond in the first 225 ms after the onset of target motion with different reward levels. Traces that travel closer to the horizontal and vertical axis show data for trials with horizontal or vertical highly rewarded directions. For simplicity of presentation, all directions were transformed to plot in the first quadrant. Symbols on the traces indicate different times after the onset of target motion. Blue, green, and red traces represent experiments with reward sizes of large versus small (L vs S), large versus medium (L vs M), and medium versus small (M vs S). C, E, Eye direction 200 ms after the onset of target motion when vertical was the highly rewarded direction minus that when horizontal was the highly rewarded direction. D, F, The weight afforded the highly rewarded direction 200 ms after the onset of target motion minus that afforded the other direction. In CF, each symbol plots the average from one experimental session. Colors have the same significance as in A and B. Lines connect the three symbols for conditions that were interleaved in the same session. Bars represent the average within each group.
Figure 7.
Figure 7.
Latency of modulation of pursuit initiation by reward size. The schematic diagrams at the top of the figure illustrate the structure of the two-target trials. Cue and target, The two tracking targets appeared during fixation, as described in Results, and provided cues for future reward. Target only, The tracking targets appeared and started to move when the fixation spot was extinguished, providing cues for future reward at the same time as motion signals for pursuit initiation. A, B, Two-dimensional plots of average vertical (V) eye velocity versus horizontal (H) eye velocity for each millisecond in the first 225 ms after the onset of target motion in different task configurations. Solid and dashed traces show results for the cue-and-target and target-only conditions. Black and gray traces show data when horizontal or vertical was the highly rewarded direction. For simplicity of presentation, all directions were transformed to plot in the first quadrant. Symbols on the traces indicate different times after the onset of target motion. C, D, For each component of eye velocity, the curves show the difference in each millisecond between the average component of eye velocity when it was in the highly rewarded versus less-rewarded direction. Left and right columns of the figure show data for two monkeys. Monkey P had lower eye speeds partly because we used lower target speeds of 20°/s, instead of 30°/s and partly because it had generally lower eye velocities in the first 100 ms of pursuit than did monkey I.
Figure 8.
Figure 8.
Effect of reward size on the expression of directional learning in pursuit. The schematic at the top of the figure shows the structure of the learning paradigm, as described in Results. A, The progression of the learned eye velocity averaged across all learning experiments of monkey I. Colors represent eye velocity in the learning direction, and each horizontal line of the image shows eye velocity as a function of time for a single trial. The trials in a learning block progress from the bottom to the top of the image. B, The time course of the average eye velocity in the learning direction for the 50th trial to the end of learning block. Blue and red traces show results when the learning target motion cued and delivered large versus small rewards. Solid and dashed traces show data from monkeys I and P. The ribbons along the traces show the SEM across experiments. C, D, Learning curves showing the acquisition of learned eye velocity in bins of 10 learning trials. Blue and red show experiments in which the learning target received a large versus a small reward. Symbols and error bars indicate the mean and SE across experiments for the eye velocity averaged across the interval from 200 to 300 ms after the onset of target motion.
Figure 9.
Figure 9.
Effect of reward size on the learned eye velocity in probe trials. A–D, Time course of the average eye velocity in the learning direction for interleaved learning and probe trials. Blue and red traces indicate responses to targets that cued and led to large or small rewards. Ribbons along the traces indicate SEM. In A and B, the learning trials provided large rewards and the probe trials provided small rewards. In C and D, the learning trials provided small rewards and the probe trials provided large rewards. E, F, Quantitative analysis of the effect of reward on the expression of the learning. Each symbol shows the average eye velocity from 200 to 300 ms after target movement during learning and probe trials in one learning block. Data are plotted so that the eye velocity for the targets with small (S) versus large (L) rewards always is on the y-axis versus x-axis. G, H, Time course of the average eye velocity in the learning direction for probe trials with intermediate reward size. Green and black traces indicate responses to probe trials that delivered medium-sized rewards in blocks in which learning trials delivered large or small rewards.

References

    1. Arkadir D, Morris G, Vaadia E, Bergman H. Independent coding of movement direction and reward prediction by single pallidal neurons. J Neurosci. 2004;24:10047–10056. - PMC - PubMed
    1. Basso MA, Pokorny JJ, Liu P. Activity of substantia nigra pars reticulata neurons during smooth pursuit eye movements in monkeys. Eur J Neurosci. 2005;22:448–464. - PubMed
    1. Blodgett HC. The effect of the introduction of reward upon the maze performance of rats. Berkeley, CA: University of California; 1929.
    1. Carey MR, Medina JF, Lisberger SG. Instructive signals for motor learning from visual cortical area MT. Nat Neurosci. 2005;8:813–819. - PMC - PubMed
    1. Case GR, Ferrera VP. Coordination of smooth pursuit and saccade target selection in monkeys. J Neurophysiol. 2007;98:2206–2214. - PubMed

Publication types

LinkOut - more resources