. 2012 Mar;262(3):894-902.
doi: 10.1148/radiol.11110663.

Normal central zone of the prostate and central zone involvement by prostate cancer: clinical and MR imaging implications

Affiliations

Normal central zone of the prostate and central zone involvement by prostate cancer: clinical and MR imaging implications

Hebert Alberto Vargas et al. Radiology. 2012 Mar.

Erratum in

  • Radiology. 2012 Aug;264(2):617

Abstract

Purpose: To describe the anatomic features of the central zone of the prostate on T2-weighted and diffusion-weighted (DW) magnetic resonance (MR) images and evaluate the diagnostic performance of MR imaging in detection of central zone involvement by prostate cancer.

Materials and methods: The institutional review board waived informed consent and approved this retrospective, HIPAA-compliant study of 211 patients who underwent T2-weighted and DW MR imaging of the prostate before radical prostatectomy. Whole-mount step-section pathologic findings were the reference standard. Two radiologists independently recorded the visibility, MR signal intensity, size, and symmetry of the central zone and scored the likelihood of central zone involvement by cancer on T2-weighted MR images and on T2-weighted MR images plus apparent diffusion coefficient (ADC) maps generated from the DW MR images. Descriptive summary statistics were calculated for central zone imaging features. Sensitivity, specificity, and area under the curve were used to evaluate reader performance in detecting central zone involvement.

Results: For readers 1 and 2, the central zone was visible, at least partially, in 177 (84%) and 170 (81%) of 211 patients, respectively. The most common imaging appearance of the central zone was symmetric, homogeneous low signal intensity. Cancers involving the central zone had higher prostate-specific antigen values, Gleason scores, and rates of extracapsular extension and seminal vesicle invasion compared with cancers not involving the central zone (P < .05). Area under the curve, sensitivity, and specificity in detecting central zone involvement were 0.70, 0.30, and 0.96 for reader 1 and 0.65, 0.35, and 0.93 for reader 2, and these values did not differ significantly between T2-weighted imaging and T2-weighted imaging plus ADC maps.

Conclusion: The central zone was visualized in most patients. Cancers involving the central zone were associated with more aggressive disease than those without central zone involvement.


Figures

Figure 1a:
Figure 1a:
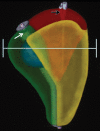
(a) Oblique sagittal and (b) axial schematic representations of the prostate zones and their relationship to the prostatic urethra (white arrow) and ejaculatory ducts (black arrow). Central zone (red), transition zone (blue), peripheral zone (yellow) and anterior fibromuscular stroma (green) are shown.
Figure 1b:
Figure 1b:
(a) Oblique sagittal and (b) axial schematic representations of the prostate zones and their relationship to the prostatic urethra (white arrow) and ejaculatory ducts (black arrow). Central zone (red), transition zone (blue), peripheral zone (yellow) and anterior fibromuscular stroma (green) are shown.
Figure 2:
Figure 2:
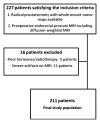
Patient selection flowchart.
Figure 3a:
Figure 3a:
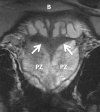
(a) Axial and (b) coronal T2-weighted MR images (4750/119) in a 64-year-old patient with prostate cancer showing the typical homogeneous low signal intensity and symmetrical appearance on either side of ejaculatory ducts (dashed arrow on a) of the central zone (arrows). B = bladder, ERC = endorectal coil, PZ = peripheral zone.
Figure 3b:
Figure 3b:
(a) Axial and (b) coronal T2-weighted MR images (4750/119) in a 64-year-old patient with prostate cancer showing the typical homogeneous low signal intensity and symmetrical appearance on either side of ejaculatory ducts (dashed arrow on a) of the central zone (arrows). B = bladder, ERC = endorectal coil, PZ = peripheral zone.
Figure 4a:
Figure 4a:
(a) Axial and (b) coronal T2-weighted MR images (3500/100.7) and (c) ADC map (4000/100.1; b values were 0 and 700 sec/mm2) obtained at 1.5 T in a 58-year-old patient with prostate cancer demonstrate areas suspicious for cancer involving the right central zone (arrows), adjacent to the ejaculatory ducts (dashed arrow). (d) Representative image from step-section pathologic map demonstrates multifocal prostate cancer (green and black lines), with the dominant tumor involving the right central zone and corresponding to the abnormality on MR images. The location of a benign hyperplastic nodule (star) in the right transition zone is shown for anatomic correlation.
Figure 4b:
Figure 4b:
(a) Axial and (b) coronal T2-weighted MR images (3500/100.7) and (c) ADC map (4000/100.1; b values were 0 and 700 sec/mm2) obtained at 1.5 T in a 58-year-old patient with prostate cancer demonstrate areas suspicious for cancer involving the right central zone (arrows), adjacent to the ejaculatory ducts (dashed arrow). (d) Representative image from step-section pathologic map demonstrates multifocal prostate cancer (green and black lines), with the dominant tumor involving the right central zone and corresponding to the abnormality on MR images. The location of a benign hyperplastic nodule (star) in the right transition zone is shown for anatomic correlation.
Figure 4c:
Figure 4c:
(a) Axial and (b) coronal T2-weighted MR images (3500/100.7) and (c) ADC map (4000/100.1; b values were 0 and 700 sec/mm2) obtained at 1.5 T in a 58-year-old patient with prostate cancer demonstrate areas suspicious for cancer involving the right central zone (arrows), adjacent to the ejaculatory ducts (dashed arrow). (d) Representative image from step-section pathologic map demonstrates multifocal prostate cancer (green and black lines), with the dominant tumor involving the right central zone and corresponding to the abnormality on MR images. The location of a benign hyperplastic nodule (star) in the right transition zone is shown for anatomic correlation.
Figure 4d:
Figure 4d:
(a) Axial and (b) coronal T2-weighted MR images (3500/100.7) and (c) ADC map (4000/100.1; b values were 0 and 700 sec/mm2) obtained at 1.5 T in a 58-year-old patient with prostate cancer demonstrate areas suspicious for cancer involving the right central zone (arrows), adjacent to the ejaculatory ducts (dashed arrow). (d) Representative image from step-section pathologic map demonstrates multifocal prostate cancer (green and black lines), with the dominant tumor involving the right central zone and corresponding to the abnormality on MR images. The location of a benign hyperplastic nodule (star) in the right transition zone is shown for anatomic correlation.
Figure 5a:
Figure 5a:
Receiver operating characteristic curves and areas under the curves for (a) reader 1 and (b) reader 2 in detecting central zone involvement by prostate cancer with use of T2-weighted images (T2WI) with and without qualitative assessment with DW MR imaging.
Figure 5b:
Figure 5b:
Receiver operating characteristic curves and areas under the curves for (a) reader 1 and (b) reader 2 in detecting central zone involvement by prostate cancer with use of T2-weighted images (T2WI) with and without qualitative assessment with DW MR imaging.
Figure 6a:
Figure 6a:
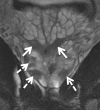
(a) Axial and (b) coronal T2-weighted MR mages (3150/105.4) in a 57-year-old patient with multifocal peripheral zone prostate cancer demonstrate similarity in T2 signal intensity of the normal central zone (arrows) and prostate cancer foci (dashed arrows).
Figure 6b:
Figure 6b:
(a) Axial and (b) coronal T2-weighted MR mages (3150/105.4) in a 57-year-old patient with multifocal peripheral zone prostate cancer demonstrate similarity in T2 signal intensity of the normal central zone (arrows) and prostate cancer foci (dashed arrows).

References

    1. McNeal JE. Regional morphology and pathology of the prostate. Am J Clin Pathol 1968;49(3):347–357 - PubMed
    1. Hricak H, Dooms GC, McNeal JE, et al. MR imaging of the prostate gland: normal anatomy. AJR Am J Roentgenol 1987;148(1):51–58 - PubMed
    1. Sommer FG, McNeal JE, Carrol CL. MR depiction of zonal anatomy of the prostate at 1.5 T. J Comput Assist Tomogr 1986;10(6):983–989 - PubMed
    1. McNeal JE, Redwine EA, Freiha FS, Stamey TA. Zonal distribution of prostatic adenocarcinoma: correlation with histologic pattern and direction of spread. Am J Surg Pathol 1988;12(12):897–906 - PubMed
    1. Noguchi M, Stamey TA, Neal JE, Yemoto CE. An analysis of 148 consecutive transition zone cancers: clinical and histological characteristics. J Urol 2000;163(6):1751–1755 - PubMed

Publication types