

Using radiation risk models in cancer screening simulations: important assumptions and effects on outcome projections
- PMID: 22357897
- PMCID: PMC3285223
- DOI: 10.1148/radiol.11110352
Using radiation risk models in cancer screening simulations: important assumptions and effects on outcome projections
Abstract
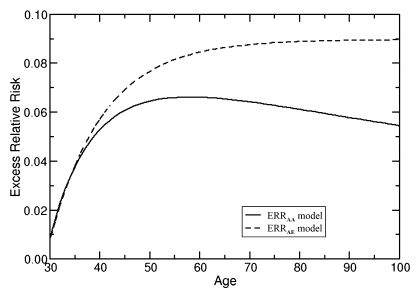
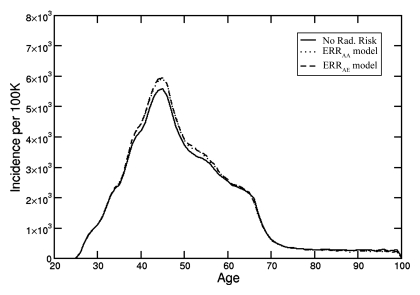
Purpose: To evaluate the effect of incorporating radiation risk into microsimulation (first-order Monte Carlo) models for breast and lung cancer screening to illustrate effects of including radiation risk on patient outcome projections.
Materials and methods: All data used in this study were derived from publicly available or deidentified human subject data. Institutional review board approval was not required. The challenges of incorporating radiation risk into simulation models are illustrated with two cancer screening models (Breast Cancer Model and Lung Cancer Policy Model) adapted to include radiation exposure effects from mammography and chest computed tomography (CT), respectively. The primary outcome projected by the breast model was life expectancy (LE) for BRCA1 mutation carriers. Digital mammographic screening beginning at ages 25, 30, 35, and 40 years was evaluated in the context of screenings with false-positive results and radiation exposure effects. The primary outcome of the lung model was lung cancer-specific mortality reduction due to annual screening, comparing two diagnostic CT protocols for lung nodule evaluation. The Metropolis-Hastings algorithm was used to estimate the mean values of the results with 95% uncertainty intervals (UIs).
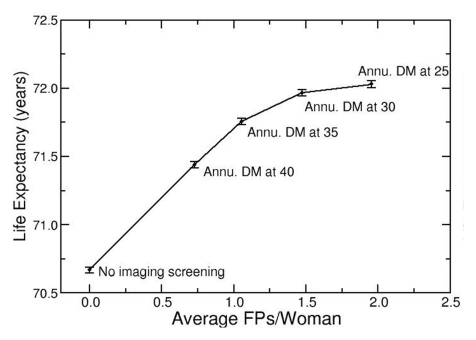
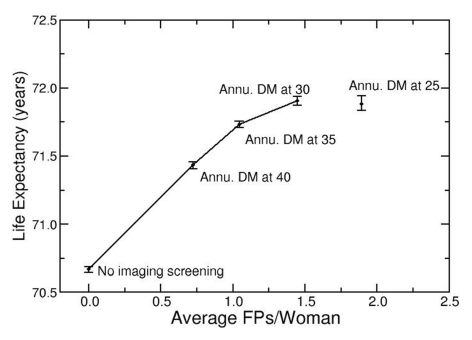
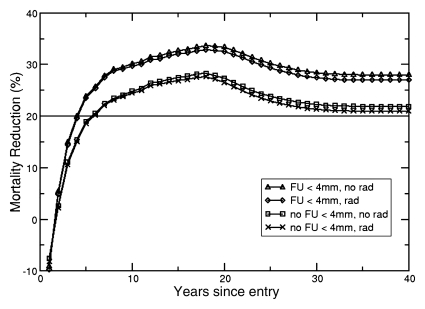
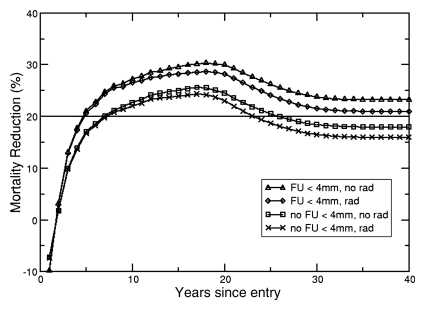
Results: Without radiation exposure effects, the breast model indicated that annual digital mammography starting at age 25 years maximized LE (72.03 years; 95% UI: 72.01 years, 72.05 years) and had the highest number of screenings with false-positive results (2.0 per woman). When radiation effects were included, annual digital mammography beginning at age 30 years maximized LE (71.90 years; 95% UI: 71.87 years, 71.94 years) with a lower number of screenings with false-positive results (1.4 per woman). For annual chest CT screening of 50-year-old females with no follow-up for nodules smaller than 4 mm in diameter, the lung model predicted lung cancer-specific mortality reduction of 21.50% (95% UI: 20.90%, 22.10%) without radiation risk and 17.75% (95% UI: 16.97%, 18.41%) with radiation risk.
Conclusion: Because including radiation exposure risk can influence long-term projections from simulation models, it is important to include these risks when conducting modeling-based assessments of diagnostic imaging.
© RSNA, 2012.
Figures
Similar articles
-
Estimated risk of radiation-induced breast cancer from mammographic screening for young BRCA mutation carriers.J Natl Cancer Inst. 2009 Feb 4;101(3):205-9. doi: 10.1093/jnci/djn440. Epub 2009 Jan 27. J Natl Cancer Inst. 2009. PMID: 19176458
-
Radiation-Induced Breast Cancer Incidence and Mortality From Digital Mammography Screening: A Modeling Study.Ann Intern Med. 2016 Feb 16;164(4):205-14. doi: 10.7326/M15-1241. Epub 2016 Jan 12. Ann Intern Med. 2016. PMID: 26756460 Free PMC article.
-
Risk of radiation-induced breast cancer from mammographic screening.Radiology. 2011 Jan;258(1):98-105. doi: 10.1148/radiol.10100655. Epub 2010 Nov 16. Radiology. 2011. PMID: 21081671
-
Radiation doses and cancer risks from breast imaging studies.Radiology. 2010 Oct;257(1):246-53. doi: 10.1148/radiol.10100570. Epub 2010 Aug 24. Radiology. 2010. PMID: 20736332 Review.
-
Screening for Lung Cancer With Low-Dose Computed Tomography: Updated Evidence Report and Systematic Review for the US Preventive Services Task Force.JAMA. 2021 Mar 9;325(10):971-987. doi: 10.1001/jama.2021.0377. JAMA. 2021. PMID: 33687468
Cited by
-
Prioritizing examination-centered over patient-centered dose reduction: a hazard of institutional "benchmarking".AJR Am J Roentgenol. 2014 May;202(5):1062-8. doi: 10.2214/AJR.13.11235. AJR Am J Roentgenol. 2014. PMID: 24758661 Free PMC article.
-
Screening for Lung Cancer: CHEST Guideline and Expert Panel Report.Chest. 2021 Nov;160(5):e427-e494. doi: 10.1016/j.chest.2021.06.063. Epub 2021 Jul 13. Chest. 2021. PMID: 34270968 Free PMC article.
-
From randomized trials to the clinic: is it time to implement individual lung-cancer screening in clinical practice? A multidisciplinary statement from French experts on behalf of the French intergroup (IFCT) and the groupe d'Oncologie de langue francaise (GOLF).Ann Oncol. 2013 Mar;24(3):586-97. doi: 10.1093/annonc/mds476. Epub 2012 Nov 7. Ann Oncol. 2013. PMID: 23136229 Free PMC article.
-
Patients with testicular cancer undergoing CT surveillance demonstrate a pitfall of radiation-induced cancer risk estimates: the timing paradox.Radiology. 2013 Mar;266(3):896-904. doi: 10.1148/radiol.12121015. Epub 2012 Dec 18. Radiology. 2013. PMID: 23249573 Free PMC article.
-
Comparative effectiveness and child health.Pharmacoeconomics. 2012 Aug 1;30(8):637-45. doi: 10.2165/11633830-000000000-00000. Pharmacoeconomics. 2012. PMID: 22788256
References
-
- Mettler FA, Jr, Bhargavan M, Faulkner K, et al. Radiologic and nuclear medicine studies in the United States and worldwide: frequency, radiation dose, and comparison with other radiation sources—1950-2007. Radiology 2009;253(2):520–531 - PubMed
-
- United Nations Scientific Committee on the Effects of Atomic Radiation Sources and effects of ionizing radiation. Medical radiation exposures, annex A. 2008 Report to the General Assembly with Annexes. New York, NY: United Nations, 2010
-
- National Council on Radiation Protection and Measurements NCRP report no. 160. Bethesda, Md: National Council on Radiation Protection and Measurements, 2009
-
- Mettler FA, Jr, Huda W, Yoshizumi TT, Mahesh M. Effective doses in radiology and diagnostic nuclear medicine: a catalog. Radiology 2008;248(1):254–263 - PubMed
-
- Cardis E, Vrijheid M, Blettner M, et al. The 15-Country Collaborative Study of Cancer Risk among Radiation Workers in the Nuclear Industry: estimates of radiation-related cancer risks. Radiat Res 2007;167(4):396–416 - PubMed
Publication types
MeSH terms
Grants and funding
LinkOut - more resources
Full Text Sources
Medical
Miscellaneous
