

Compressive sensing could accelerate 1H MR metabolic imaging in the clinic
- PMID: 22357898
- PMCID: PMC3285227
- DOI: 10.1148/radiol.11111098
Compressive sensing could accelerate 1H MR metabolic imaging in the clinic
Abstract
Purpose: To retrospectively evaluate the fidelity of magnetic resonance (MR) spectroscopic imaging data preservation at a range of accelerations by using compressed sensing.
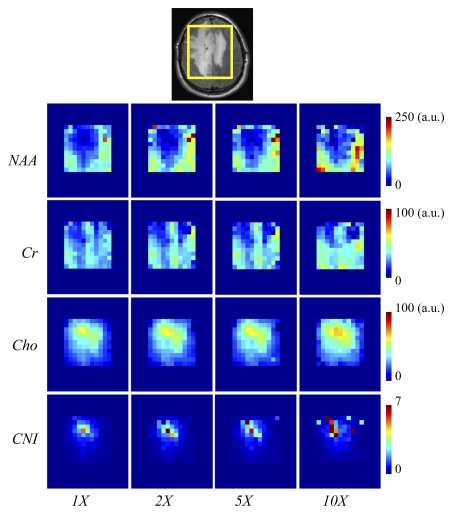
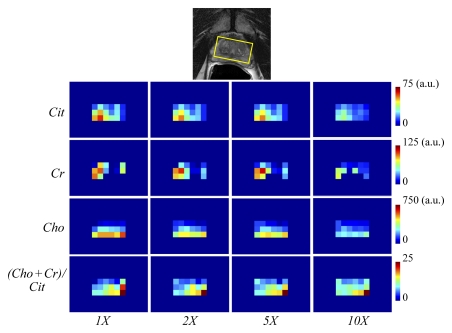
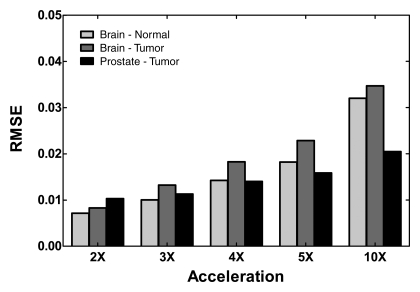
Materials and methods: The protocols were approved by the institutional review board of the university, and written informed consent to acquire and analyze MR spectroscopic imaging data was obtained from the subjects prior to the acquisitions. This study was HIPAA compliant. Retrospective application of compressed sensing was performed on 10 clinical MR spectroscopic imaging data sets, yielding 600 voxels from six normal brain data sets, 163 voxels from two brain tumor data sets, and 36 voxels from two prostate cancer data sets for analysis. The reconstructions were performed at acceleration factors of two, three, four, five, and 10 and were evaluated by using the root mean square error (RMSE) metric, metabolite maps (choline, creatine, N-acetylaspartate [NAA], and/or citrate), and statistical analysis involving a voxelwise paired t test and one-way analysis of variance for metabolite maps and ratios for comparison of the accelerated reconstruction with the original case.
Results: The reconstructions showed high fidelity for accelerations up to 10 as determined by the low RMSE (< 0.05). Similar means of the metabolite intensities and hot-spot localization on metabolite maps were observed up to a factor of five, with lack of statistically significant differences compared with the original data. The metabolite ratios of choline to NAA and choline plus creatine to citrate did not show significant differences from the original data for up to an acceleration factor of five in all cases and up to that of 10 for some cases.
Conclusion: A reduction of acquisition time by up to 80%, with negligible loss of information as evaluated with clinically relevant metrics, has been successfully demonstrated for hydrogen 1 MR spectroscopic imaging.
© RSNA, 2012.
Figures
Comment in
-
Acceleration of 1H MR metabolic imaging with compressed sensing.Radiology. 2013 Feb;266(2):686. doi: 10.1148/radiol.12121692. Radiology. 2013. PMID: 23362099 No abstract available.
-
Response.Radiology. 2013 Feb;266(2):686-7. Radiology. 2013. PMID: 23479784 No abstract available.
Similar articles
-
2-D magnetic resonance spectroscopic imaging of the pediatric brain using compressed sensing.Pediatr Radiol. 2019 Dec;49(13):1798-1808. doi: 10.1007/s00247-019-04495-1. Epub 2019 Aug 28. Pediatr Radiol. 2019. PMID: 31463513
-
Preoperative grading of gliomas by using metabolite quantification with high-spatial-resolution proton MR spectroscopic imaging.Radiology. 2006 Mar;238(3):958-69. doi: 10.1148/radiol.2382041896. Epub 2006 Jan 19. Radiology. 2006. PMID: 16424238
-
Contribution of Histopathologic Tissue Composition to Quantitative MR Spectroscopy and Diffusion-weighted Imaging of the Prostate.Radiology. 2016 Mar;278(3):801-11. doi: 10.1148/radiol.2015142889. Epub 2015 Sep 29. Radiology. 2016. PMID: 26418614
-
Prostate MRI and 3D MR spectroscopy: how we do it.AJR Am J Roentgenol. 2010 Jun;194(6):1414-26. doi: 10.2214/AJR.10.4312. AJR Am J Roentgenol. 2010. PMID: 20489079 Free PMC article. Review.
-
Novel biomarker for prostate cancer diagnosis by MRS.Front Biosci (Landmark Ed). 2014 Jun 1;19(7):1186-201. doi: 10.2741/4275. Front Biosci (Landmark Ed). 2014. PMID: 24896344 Review.
Cited by
-
Compressed sensing MRI: a review from signal processing perspective.BMC Biomed Eng. 2019 Mar 29;1:8. doi: 10.1186/s42490-019-0006-z. eCollection 2019. BMC Biomed Eng. 2019. PMID: 32903346 Free PMC article. Review.
-
In vivo (1)H MRSI of glycine in brain tumors at 3T.Magn Reson Med. 2016 Jan;75(1):52-62. doi: 10.1002/mrm.25588. Epub 2015 Feb 4. Magn Reson Med. 2016. PMID: 25651788 Free PMC article.
-
Clinical application of ultra-high resolution compressed sensing time-of-flight MR angiography at 7T to detect small vessel pathology.Neuroradiol J. 2023 Jun;36(3):335-340. doi: 10.1177/19714009221129576. Epub 2022 Sep 29. Neuroradiol J. 2023. PMID: 36173305 Free PMC article.
-
Rapid dynamic contrast-enhanced MRI for small animals at 7T using 3D ultra-short echo time and golden-angle radial sparse parallel MRI.Magn Reson Med. 2019 Jan;81(1):140-152. doi: 10.1002/mrm.27357. Epub 2018 Jul 29. Magn Reson Med. 2019. PMID: 30058079 Free PMC article.
-
Accelerated MR spectroscopic imaging-a review of current and emerging techniques.NMR Biomed. 2021 May;34(5):e4314. doi: 10.1002/nbm.4314. Epub 2020 May 12. NMR Biomed. 2021. PMID: 32399974 Free PMC article. Review.
References
-
- Daly PF, Cohen JS. Magnetic resonance spectroscopy of tumors and potential in vivo clinical applications: a review. Cancer Res 1989;49(4):770–779 - PubMed
-
- Pirzkall A, Li XJ, Oh JM, et al. 3D MRSI for resected high-grade gliomas before RT: tumor extent according to metabolic activity in relation to MRI. Int J Radiat Oncol Biol Phys 2004;59(1):126–137 - PubMed
-
- Nelson SJ, Vigneron DB, Dillon WP. Serial evaluation of patients with brain tumors using volume MRI and 3D 1H MRSI. NMR Biomed 1999;12(3):123–138 - PubMed
Publication types
MeSH terms
Substances
Grants and funding
LinkOut - more resources
Full Text Sources
Medical
