. 2012 Apr;18(4):640-52.
doi: 10.1261/rna.030775.111. Epub 2012 Feb 22.

Conservation of the relative tRNA composition in healthy and cancerous tissues

Affiliations

Conservation of the relative tRNA composition in healthy and cancerous tissues

Shelly Mahlab et al. RNA. 2012 Apr.

Abstract

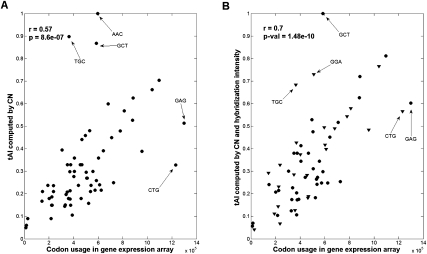
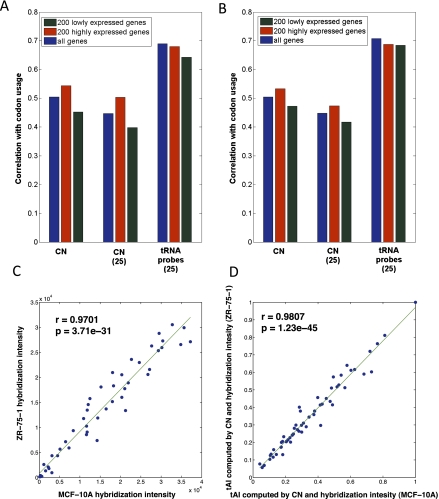
Elongation in protein translation is strongly dependent on the availability of mature transfer RNAs (tRNAs). The relative concentrations of the tRNA isoacceptors determine the translation efficiency in unicellular organisms. However, the degree of correspondence of codons and the relevant tRNA isoacceptors serves as an estimator for translation efficiency in all organisms. In this study, we focus on the translational capacity of the human proteome. We show that the correspondence between the codon usage and tRNAs can be improved by combining experimental measurements with the genomic copy number of isoacceptor groups. We show that there are technologies of tRNA measurements that are useful for our analysis. However, fragments of tRNAs do not agree with translational capacity. It was shown that there is a significant increase in the absolute levels of tRNA genes in cancerous cells in comparison to healthy cells. However, we find that the relative composition of tRNA isoacceptors in healthy, cancerous, or transformed cells remains almost identical. This result may indicate that maintaining the relative tRNA composition in cancerous cells is advantageous via its stabilizing of the effectiveness of translation.


Figures

FIGURE 1.
FIGURE 1.
The levels of resolution in tRNAs analyses. (A) An illustration for tRNA quantitative analyses at varying levels of resolution is shown. (i) There are 21 amino acids that are decoded by tRNAs including selanocysteine. (ii) tRNA isoacceptor groups specified by the number of different tRNA carrying different anticodons. There are 51 such tRNA types that are grouped to match the 21 amino acids. Each amino acid has a different number of isoacceptor groups. In this example, alanine (Ala) is decoded by three isoacceptor groups. (iii) Codons that encode each amino acid. There are 62 codons in total. (iv) Each tRNA isoacceptor group has a different number of tRNA genes, referred to as genomic tRNA copy number (CN). For example, the 43 tRNAs for Ala are grouped into 29, 5, and 9 groups. The 512 tRNAs are grouped into the 51 tRNA isoacceptor groups, some with only a single tRNA (Tyr for the ATA codon) and others with as high as 32 tRNAs (Asn for the GTT codon). Among the tRNAs, some of the genes share the same sequences (gray), resulting in only 434 sequence-unique tRNA genes. (B) A flow diagram of the analyses performed in this study is shown. We considered experimental data from deep sequencing (referred to as “Reads”), tRNA probe array (referred to as “Hybridization”), and transcriptomic gene expression (referred to as “Codon Usage”). Experimentally, data were compared among themselves (blue arrows) and for the various human cell lines and tissues (brown). Additional quantitative data are derived from the genomic data of the genomic tRNA copy numbers (referred to as “CN”). We analyzed the correlations between the experimental data of tRNA, the cell transcriptome, and the isoacceptor groups by the genomic CN (purple arrows). See details in the text.
FIGURE 2.
FIGURE 2.
Correlation between the genomic copy number and the amino acid usage from epithelial normal cell line MCF-10A. Each codon from the cell transcriptome (10,132 identified expressed genes) was multiplied by the relative gene expression signal. The number of tRNA genes grouped by tRNA isoacceptor groups specifies each amino acid. The 21 amino acids are abbreviated according to standard convention, with SeCys denoting selanocysteine. The maximal value in the x-axis is for alanine (A) with a total of 43 tRNA genes.
FIGURE 3.
FIGURE 3.
Expression levels of tRNA types for GM12878 cells by RNA-seq sequencing technology. The total reads that match tRNA genes from GM12878 samples are indicated. (A–C) The ENCODE data set is based on short (20–200 nt) non-poly(A) RNA. (D–F) The data set was extracted from the RNA polymerase III (Pol III) immunoprecipitation experiment. The reads were normalized and presented as a sorted list according to the relative read values (A,D). (B,E) The list includes the relative log abundance above and below the expectation value according to the 51 available tRNA types (note that tRNAs that had no reads are not shown). The correlation of the absolute number of reads and the genomics tRNA copy numbers is plotted. The correlation coefficient (r) value and the P-value are indicated (C,F). Note that the correlations and the P-values were calculated from the original dot plots. The data are shown in a log scale for data compression graphical reasons.
FIGURE 4.
FIGURE 4.
Correlation of the hybridization intensity and tRNA genomics copy number of MCF-10A cells. The correlation is according to the tRNA copy number and the unique 30 probes from the tRNA microarray experiments described in Pavon-Eternod et al. (2009). The 30 tRNA probes cover 25 tRNA isoacceptor groups. Some of the outliers are indicated by their codons.
FIGURE 5.
FIGURE 5.
Schematic view of the relation between the tRNA isoacceptor groups and codon usage. (A) Restricted wobble rules are indicated. (Red) The cognate-matched corresponding codon; (orange) the match with the wobble codon. (Bottom table) The values for human threonine (Thr). There are four potential anticodons; however, in human, one of them is missing (GGT). When sorted by the relative copy number (RGF), this anticodon has the highest number of tRNA genes in the Thr isoacceptor group. However, it is ranked only third by the RSCU (red). The RSCU reflects the codon usage within the relevant isoacceptor group. The codon ACC that is decoded by the wobble rule is sorted on the top of the RSCU (orange). (B) Codons are grouped by their detailed tRNA isoacceptor groups. The six-codon amino acids (Arg, Leu, Ser) were fractionated to their groups according to their identity in positions 2 and 3 of their anticodons [(i) four-codon and (ii) two-codon groups]. The perfectly matched codon–anticodon (red); the wobble codon (orange). The matrix is colored by the rank of the codons sorted according to the RGF (as in A). In the case in which the copy number for the tRNAs within an isoacceptor group is identical, it is colored green. Amino acids that are decoded by a single tRNA type (blue). (Dark yellow) Potentially a wobble codon; but a tRNA exists that perfectly matches the indicated codon. In 16/19 isoacceptor groups, the perfectly matched anticodon or the wobble codon is also the codon that is used the most (based on RSCU of the MCF-10A transcriptome). The source data are provided in Supplemental Table S2. (C) Distributions of mRNA codon usage and copy number. The mRNA codon usage (red bars) was calculated based on the gene expression array from the MCF-10A cell line and was compared with the genomic tRNA copy number (blue bars). The data are used for calculating the dKL between the two distributions.
FIGURE 6.
FIGURE 6.
Correlation of the tRNA measurements and the codon usage of MCF-10A cells. (A) The tAI value of each codon was computed using the genomic tRNA copy number of the tRNA genes. Recall that the calculation by the tAI covers all 62 codons. (B) The tAI values of each codon were computed using the normalized values from the hybridization intensity levels. The missing values are inferred based on the genomic tRNA copy number (triangles). Note that the overall correlation was significantly increased when the tAI was calculated based on a combination of the genomic tRNA copy number and the actual experimental data (based on the hybridization intensity from the 30 unique probes).
FIGURE 7.
FIGURE 7.
Correlation between codon usage and tRNA approximations. The correlation according to the tRNA copy number (CN) and the codon usage based on the MCF-10A transcriptome (A) and the same data analysis from the cancer ZR-75-1 cell line (B). The CN is based on those that were selected for the 25 tRNA isoacceptor groups. Note that these are identical to the 30 elected probes from the tRNA microarray experiments. The tRNA probes applied the actual measurements from the 30 probes that are associated with 25 tRNA isoacceptor groups. Note that few of the tRNA probes hybridize to the same isoacceptor tRNA type. The correlation with all genes (blue bar) concerns all expressed genes in the transcriptome (10,132 genes). (Red bar) The 200 most highly expressed genes in the array; (dark green bar) the 200 lowly expressed genes. (C) Correlation of tRNA probes hybridization intensity. (D) The tAI computed by the combination of the tRNA copy number with the hybridization intensity. The correlations performed for normal (MCF-10A) and cancerous (ZR-75-1) cell lines. The raw data were from Pavon-Eternod et al. (2009). The correlation and the P-values are reported.
FIGURE 8.
FIGURE 8.
Calculation of the dKL of the tRNA expression levels in healthy and diseased tissues. The values of the dKL measures are shown by a color gradient (black to red). The calculations are based on the hybridization signals from the 30 unique tRNA probes for healthy (three samples) and cancerous tissue samples (nine samples). The symmetric matrix indicates the clustering of the 13 columns in the matrix. The diagonal is indicated as dKL = 0. (The left column and the bottom row of the matrix) The dKL for the tRNA hybridization intensity and the genomic tRNA copy number (CN). (Red) A weaker correspondence (higher dKL value). The columns are sorted based on the clustering. The correlations, the minimum dKL, and the P-values are listed in Supplemental Table S3. The samples are colored by their labels as ER/HER2: 59826, 60046, 62706, 62944 (blue); ER/HER2+: 46258, 58955 (red); ER+/HER2: 41299, 57731, 45163 (orange); and healthy breast tissues: A-01, A-06, and S-23 (green). Note that there is no clear separation between ER/HER2+ and ER+/HER2 by this measure.

Similar articles

Cited by

References

    1. Anderson WF 1969. The effect of tRNA concentration on the rate of protein synthesis. Proc Natl Acad Sci 62: 566–573 - PMC - PubMed
    1. Arava Y, Wang Y, Storey JD, Liu CL, Brown PO, Herschlag D 2003. Genome-wide analysis of mRNA translation profiles in Saccharomyces cerevisiae. Proc Natl Acad Sci 100: 3889–3894 - PMC - PubMed
    1. Beck D, Ayers S, Wen J, Brandl MB, Pham TD, Webb P, Chang CC, Zhou X 2011. Integrative analysis of next generation sequencing for small non-coding RNAs and transcriptional regulation in myelodysplastic syndromes. BMC Med Genomics 4: 19 doi: 10.1186/1755-8794-4-19 - PMC - PubMed
    1. Bulmer M 1987. Coevolution of codon usage and transfer RNA abundance. Nature 325: 728–730 - PubMed
    1. Cole C, Sobala A, Lu C, Thatcher SR, Bowman A, Brown JW, Green PJ, Barton GJ, Hutvagner G 2009. Filtering of deep sequencing data reveals the existence of abundant Dicer-dependent small RNAs derived from tRNAs. RNA 15: 2147–2160 - PMC - PubMed

Publication types

LinkOut - more resources