. 2012 Apr;18(4):684-93.
doi: 10.1261/rna.029587.111. Epub 2012 Feb 22.

Transcription regulates telomere dynamics in human cancer cells

Affiliations

Transcription regulates telomere dynamics in human cancer cells

Rajika Arora et al. RNA. 2012 Apr.

Abstract

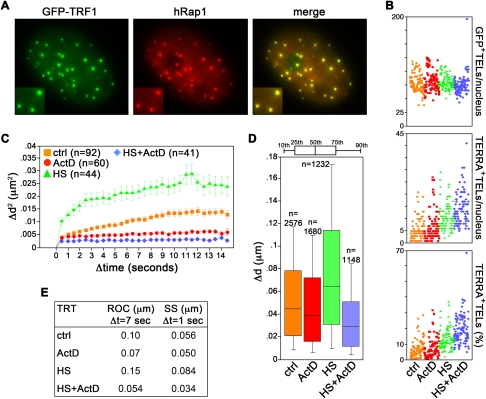
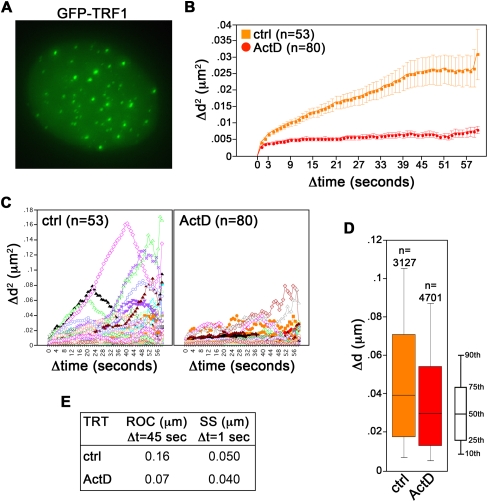
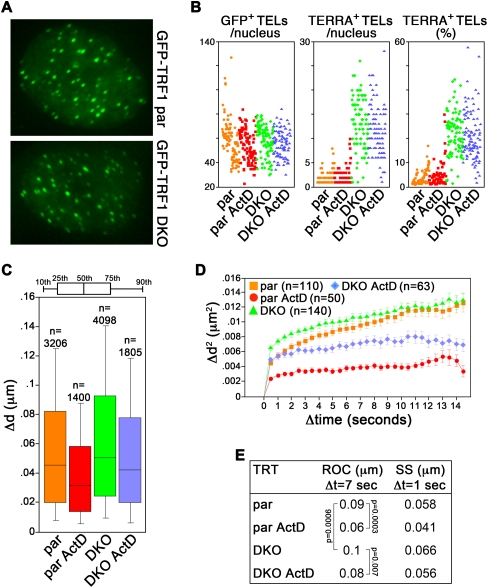
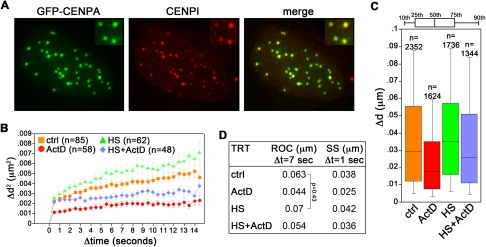
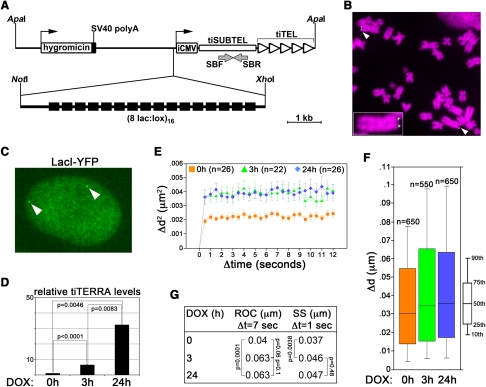
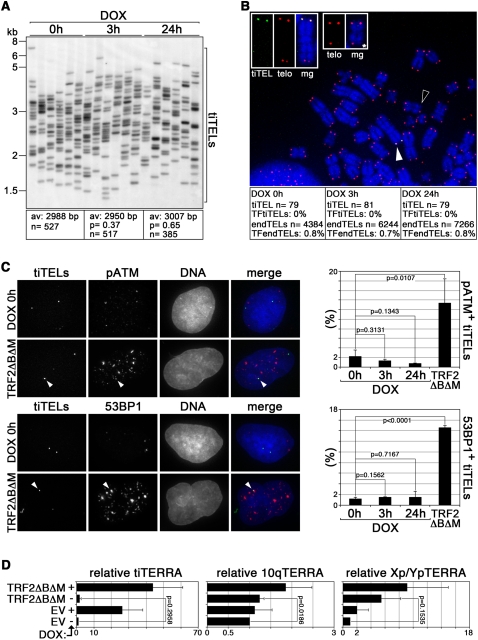
Telomeres are nucleoprotein structures capping the physical ends of linear eukaryotic chromosomes. Although largely heterochromatic, telomeres are transcribed into telomeric repeat-containing RNA (TERRA) molecules by RNA polymerase II. The functions associated with telomere transcription and TERRA remain ill defined. Here we show that the transcriptional activity of human telomeres directly regulates their movement during interphase. We find that chemical inhibition of global transcription dampens telomere motion, while global stimulation promotes it. Likewise, when DNA methyltransferase enzymes are deleted to augment telomere transcription, we observe increased telomere movement. Finally, using a cell line engineered with a unique transcriptionally inducible telomere, we show that transcription of one specific telomere stimulates only its own dynamics without overtly affecting its stability or its length. We reveal a new and unforeseen function for telomere transcription as a regulator of telomere motion, and speculate on the intriguing possibility that transcription-dependent telomere motion sustains the maintenance of functional and dysfunctional telomeres.


Figures

FIGURE 1.
FIGURE 1.
Telomere movement correlates with the transcriptional state of the cell. (A) HeLa cells expressing GFP–TRF1 (green) were immunostained for the telomeric factor hRap1 (red). Enlarged regions are shown at the bottom left corners. (B) TERRA RNA FISH analysis of HeLa cells expressing GFP–TRF1. (Top) Total number of GFP–TRF1 foci (GFP+ TELs) per nucleus; (middle) total number of TERRA-positive telomeres (TERRA+ TELs) per nucleus; (bottom) percentage of TERRA-positive telomeres per nucleus (TERRA+ TELs). Each colored dot represents data from one nucleus. A total of ∼100 nuclei from two independent experiments were analyzed per treatment. (CE) HeLa GFP-TRF1 cells were treated with Actinomycin D (ActD) for 30 min or heat shock (HS) for 60 min, or heat shocked for 60 min and treated with ActD for the last 30 min (HS + ActD). Images were taken at a single focal plane every 0.5 sec over 15 sec. (C) Average mean square change in relative distance between two neighboring telomeres. The number of analyzed telomere pairs is indicated (n). (D) Step size (SS) distribution for Δt of 1 sec. The number of data points is indicated (n). (E) Values for radius of confinement (ROC) and SS for the indicated treatments (TRT). All P-values are <0.0001, and therefore are not indicated.
FIGURE 2.
FIGURE 2.
Transcription-dependent movement of natural telomeres in U2OS cells. (A) U2OS cells were infected with retroviruses expressing GFP–TRF1 fusion protein (shown in green). (BE) Live imaging of GFP–TRF1-tagged telomeres in cells treated with Actinomycin D (ActD) or left untreated (control cells: ctrl) was performed at a single focal plane every 1 sec over 60 sec. Image analysis was as in Figure 1. (C) Single tracks of GFP–TRF1-tagged telomeres are shown. All P-values are <0.0001, and therefore are not indicated.
FIGURE 3.
FIGURE 3.
DNMT 1 and 3b restrain telomere movements. (A) Visualization of GFP–TRF1 in HTC116 parental (par) and DNMT1 and DNMT3b double knocked-out (DKO) cells. (B) Scatter plots showing the number of GFP+ TELs (left), TERRA+ TELs (middle), and percentage of TERRA+ TELs (right) per nucleus from RNA FISH analysis of par and DKO cells expressing GFP–TRF1 treated as indicated. Each colored dot represents data from one nucleus. A total of ∼100 nuclei from two independent experiments were analyzed per treatment. (CE) Cells were treated with ActD for 30 min before live imaging or left untreated. Live imaging and analysis were performed as in Figure 1. All P-values are <0.0001 unless indicated.
FIGURE 4.
FIGURE 4.
Centromere movement correlates with the transcriptional state of the cell. (A) HeLa cells expressing GFP–CENPA (green) were stained using antibodies against the endogenous centromeric protein CENPI (in red). (BD) Cell treatments and live imaging were performed as in Figure 1. All P-values are <0.0001 unless indicated.
FIGURE 5.
FIGURE 5.
“Transcriptionally inducible telomeres” (tiTELs). (A) Sketch of the telomere seeding plasmid. (iCMV) Inducible CMV promoter; (SBF and SBR) oligonucleotides used in RT–PCR experiments; (black boxes) LacO repeats. (B) Partial cl32 metaphase hybridized in situ with fluorescently labeled LacO-repeat DNA oligonucleotides (green). DAPI-stained DNA is in magenta. White arrowheads point to tiTELs. The small tiTEL-containing chromosome on the right is enlarged in the inset to help visualization. (C) Visualization of tiTELs as bright nuclear foci (white arrowheads) upon stable expression of LacI–YFP (green). The nuclear territory is marked by a diffuse signal. (D) Quantitative RT–PCR analysis of tiTERRA levels upon doxycycline (DOX) treatment. TiTERRA values are expressed as fold increase over untreated samples. Bars and error bars are averages and standard deviations from either two (3-h) or three (24-h) independent experiments. P-values are indicated. (EG) For live imaging, images were taken at a single focal plane every 0.5 sec over 15 sec. (E) Average mean square change in distance of tiTELs. The number of tracked tiTELs is indicated (n). (F) Distribution of SS for Δt of 1 sec. The number of data points is indicated (n). (G) Values for tiTEL ROC and SS calculated for the indicated DOX treatments. All P-values are <0.001 unless indicated.
FIGURE 6.
FIGURE 6.
Transcription induction does not compromise tiTEL stability. (A) STELA analysis of tiTEL length in cells treated as indicated. Average (av) telomere length is indicated together with the number (n) of tiTELs analyzed. Molecular weights are on the left in kilobases. (B) DNA FISH on metaphase chromosomes prepared from cl32 cells treated as indicated. TiTELs were identified with LacO PNA probes (in green), telomeric sequences (telo) were detected using telomeric PNA probes (in red). DAPI-stained DNA is in blue. The white and black arrowheads point to the tiTEL enlarged at the top (three left panels) and to an example of telomere free end (*) enlarged at the top (two right panels), respectively. Single channels and merged (mg) channels are shown. The fraction of telomere-free tiTELs (TFtiTELs), and endogenous telomere-free ends (TFendTELs) are indicated. Experiments were performed in duplicate and the cumulative number of analyzed tiTELs and endTELs are indicated (n) (C) cl32 cells expressing LacI–YFP were treated with DOX or infected with retroviruses expressing TRF2ΔBΔM. TiTELs were visualized using the YFP fluorescence (in green in the merge panels), while ATM phosphorylated at Serine 1981 (pATM) and 53BP1 were visualized by indirect immunofluorescence (in red). The arrowheads point to tiTELs colocalizing with pATM and with 53BP1. Bar graphs represent the fraction of tiTELs colocalizing with pATM or with 53BP1. Bars and error bars are averages and standard deviations from three independent experiments. (D) Quantitative RT–PCR analysis of tiTERRA and of endogenous TERRA transcribed from 10q and Xp/Yp chromosome ends in cl32 cells infected with TRF2ΔBΔM-expressing retroviruses or with empty vector (EV) retroviruses. TERRA values are expressed as fold increase over EV-infected, untreated cells. Bars and error bars are averages and standard deviations from either two (Xp/Yp) or three (tiTERRA and 10q) independent experiments; P-values are indicated.

References

    1. Arora R, Brun CM, Azzalin CM 2010. TERRA: Long noncoding RNA at eukaryotic telomeres. Prog Mol Subcell Biol 51: 65–94 - PubMed
    1. Azzalin CM, Reichenbach P, Khoriauli L, Giulotto E, Lingner J 2007. Telomeric repeat containing RNA and RNA surveillance factors at mammalian chromosome ends. Science 318: 798–801 - PubMed
    1. Baird DM, Rowson J, Wynford-Thomas D, Kipling D 2003. Extensive allelic variation and ultrashort telomeres in senescent human cells. Nat Genet 33: 203–207 - PubMed
    1. Barnett MA, Buckle VJ, Evans EP, Porter AC, Rout D, Smith AG, Brown WR 1993. Telomere directed fragmentation of mammalian chromosomes. Nucleic Acids Res 21: 27–36 - PMC - PubMed
    1. Boyle S, Gilchrist S, Bridger JM, Mahy NL, Ellis JA, Bickmore WA 2001. The spatial organization of human chromosomes within the nuclei of normal and emerin-mutant cells. Hum Mol Genet 10: 211–219 - PubMed

Publication types

LinkOut - more resources