

Glucagon-like peptide 1 recruits microvasculature and increases glucose use in muscle via a nitric oxide-dependent mechanism
- PMID: 22357961
- PMCID: PMC3314347
- DOI: 10.2337/db11-1073
Glucagon-like peptide 1 recruits microvasculature and increases glucose use in muscle via a nitric oxide-dependent mechanism
Abstract
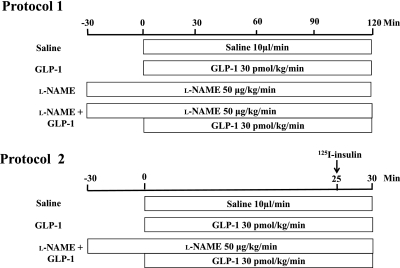
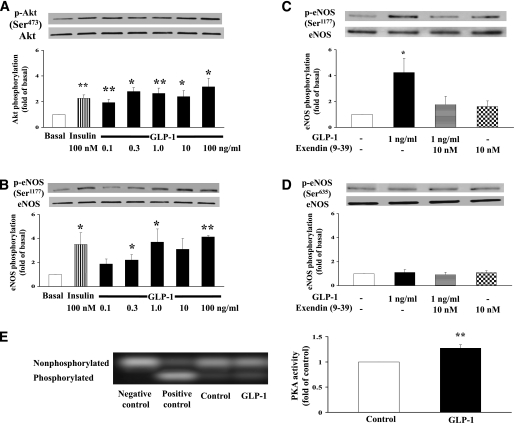
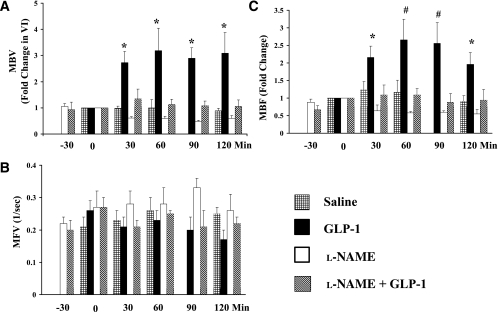
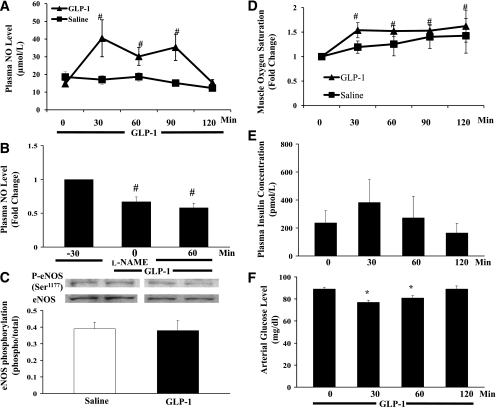
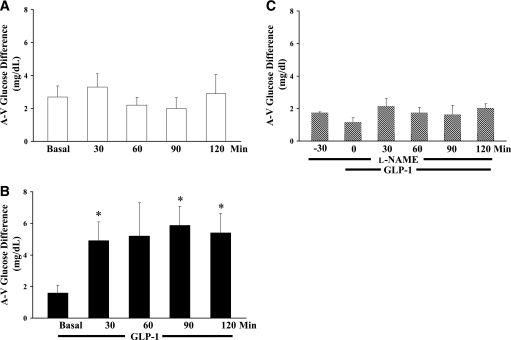
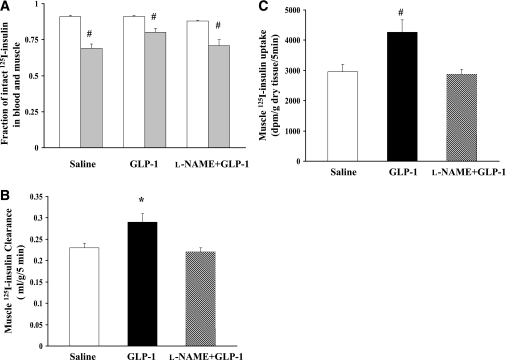
Glucagon-like peptide 1 (GLP-1) increases tissue glucose uptake and causes vasodilation independent of insulin. We examined the effect of GLP-1 on muscle microvasculature and glucose uptake. After confirming that GLP-1 potently stimulates nitric oxide (NO) synthase (NOS) phosphorylation in endothelial cells, overnight-fasted adult male rats received continuous GLP-1 infusion (30 pmol/kg/min) for 2 h plus or minus NOS inhibition. Muscle microvascular blood volume (MBV), microvascular blood flow velocity (MFV), and microvascular blood flow (MBF) were determined. Additional rats received GLP-1 or saline for 30 min and muscle insulin clearance/uptake was determined. GLP-1 infusion acutely increased muscle MBV (P < 0.04) within 30 min without altering MFV or femoral blood flow. This effect persisted throughout the 120-min infusion period, leading to a greater than twofold increase in muscle MBF (P < 0.02). These changes were paralleled with increases in plasma NO levels, muscle interstitial oxygen saturation, hind leg glucose extraction, and muscle insulin clearance/uptake. NOS inhibition blocked GLP-1-mediated increases in muscle MBV, glucose disposal, NO production, and muscle insulin clearance/uptake. In conclusion, GLP-1 acutely recruits microvasculature and increases basal glucose uptake in muscle via a NO-dependent mechanism. Thus, GLP-1 may afford potential to improve muscle insulin action by expanding microvascular endothelial surface area.
Figures
References
-
- Vilsbøll T, Krarup T, Deacon CF, Madsbad S, Holst JJ. Reduced postprandial concentrations of intact biologically active glucagon-like peptide 1 in type 2 diabetic patients. Diabetes 2001;50:609–613 - PubMed
-
- Toft-Nielsen M-B, Damholt MB, Madsbad S, et al. Determinants of the impaired secretion of glucagon-like peptide-1 in type 2 diabetic patients. J Clin Endocrinol Metab 2001;86:3717–3723 - PubMed
-
- Vilsbøll T, Krarup T, Sonne J, et al. Incretin secretion in relation to meal size and body weight in healthy subjects and people with type 1 and type 2 diabetes mellitus. J Clin Endocrinol Metab 2003;88:2706–2713 - PubMed
-
- Jones IR, Owens DR, Luzio S, Williams S, Hayes TM. The glucose dependent insulinotropic polypeptide response to oral glucose and mixed meals is increased in patients with type 2 (non-insulin-dependent) diabetes mellitus. Diabetologia 1989;32:668–677 - PubMed
-
- Drucker DJ. The biology of incretin hormones. Cell Metab 2006;3:153–165 - PubMed
Publication types
MeSH terms
Substances
Grants and funding
LinkOut - more resources
Full Text Sources
Other Literature Sources
Medical
