Meta-Analysis
. 2012 Apr;123(4):473-84.
doi: 10.1007/s00401-012-0958-8. Epub 2012 Feb 23.

Molecular subgroups of medulloblastoma: an international meta-analysis of transcriptome, genetic aberrations, and clinical data of WNT, SHH, Group 3, and Group 4 medulloblastomas

Affiliations
Meta-Analysis

Molecular subgroups of medulloblastoma: an international meta-analysis of transcriptome, genetic aberrations, and clinical data of WNT, SHH, Group 3, and Group 4 medulloblastomas

Marcel Kool et al. Acta Neuropathol. 2012 Apr.

Abstract

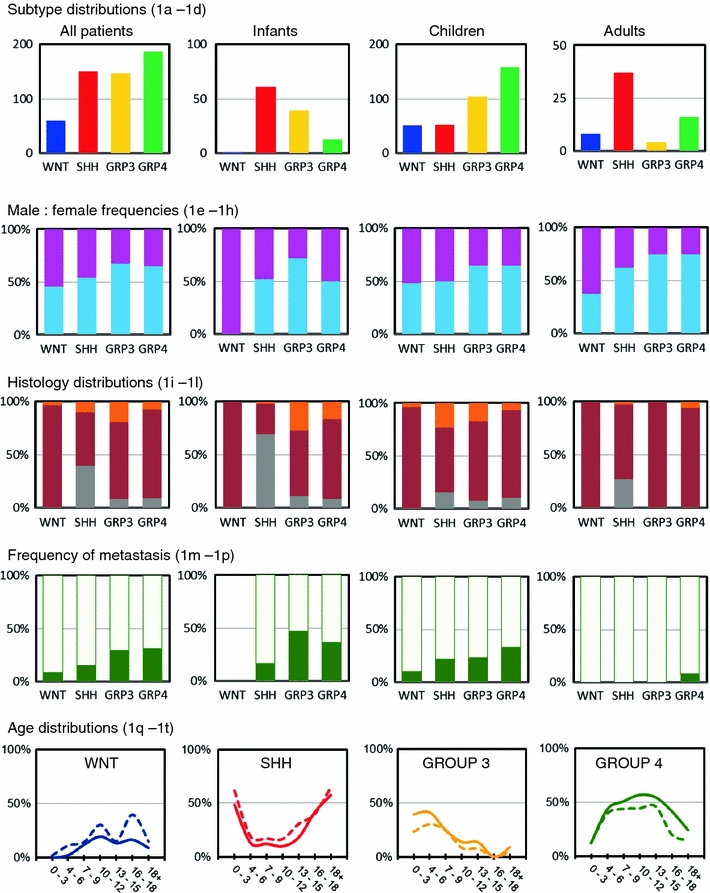
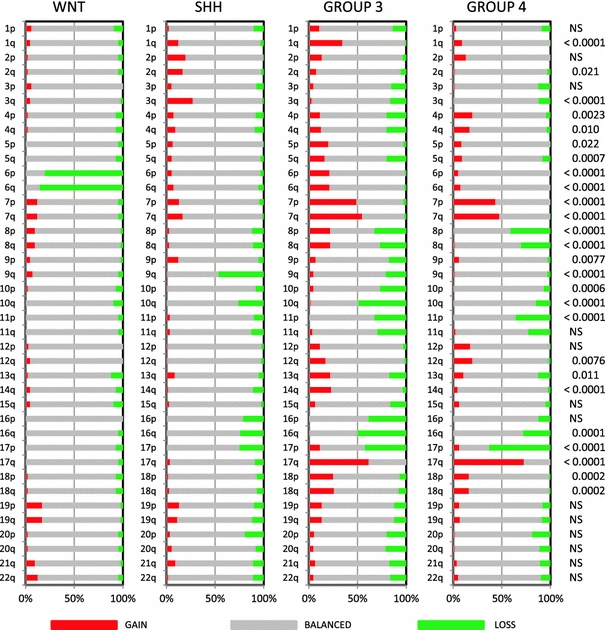
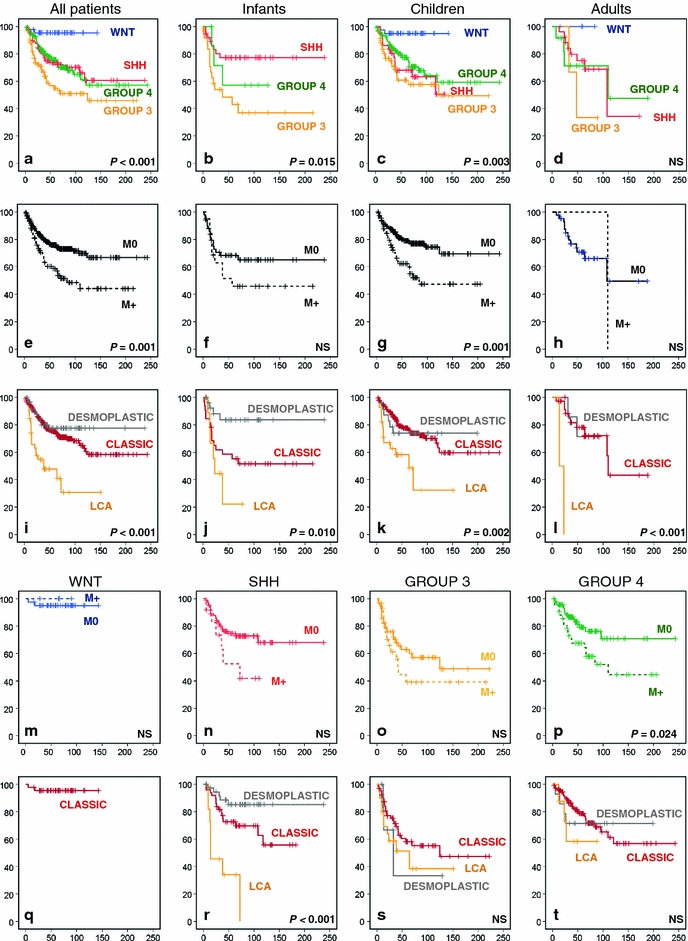
Medulloblastoma is the most common malignant brain tumor in childhood. Molecular studies from several groups around the world demonstrated that medulloblastoma is not one disease but comprises a collection of distinct molecular subgroups. However, all these studies reported on different numbers of subgroups. The current consensus is that there are only four core subgroups, which should be termed WNT, SHH, Group 3 and Group 4. Based on this, we performed a meta-analysis of all molecular and clinical data of 550 medulloblastomas brought together from seven independent studies. All cases were analyzed by gene expression profiling and for most cases SNP or array-CGH data were available. Data are presented for all medulloblastomas together and for each subgroup separately. For validation purposes, we compared the results of this meta-analysis with another large medulloblastoma cohort (n = 402) for which subgroup information was obtained by immunohistochemistry. Results from both cohorts are highly similar and show how distinct the molecular subtypes are with respect to their transcriptome, DNA copy-number aberrations, demographics, and survival. Results from these analyses will form the basis for prospective multi-center studies and will have an impact on how the different subgroups of medulloblastoma will be treated in the future.


Figures

Fig. 1
Fig. 1
Demographic distribution of medulloblastoma subgroups. Subgroup distribution is shown for all medulloblastoma patients (a), infants (age <4 years) (b), children (age 4–16) (c), and adults (age >16) (d). Numbers on the Y axis indicate number of patients. Male:female frequencies are shown for all four subgroups in all patients (e), infants (f), children (g), and adults (h). Males are indicated in blue, females in pink. Distribution of histological subtype is shown for all four subgroups in all patients (i), infants (j), children (k), and adults (l). Classic histology is indicated in dark red, desmoplastic/extensive nodular histology in gray, and large cell/anaplastic histology in orange. Frequencies of metastasized (green) and non-metastasized (light green) cases are shown for all four subgroups in all patients (m), infants (n), children (o), and adults (p). Age distribution shown for males (solid lines) and females (dotted lines) is plotted for each of the four subgroups: WNT (q), SHH (r), Group 3 (s), and Group 4 (t). Numbers on the Y axis indicate the frequency of that particular subgroup within the indicated age group (in years) on the X axis among all patients
Fig. 2
Fig. 2
Overview of chromosomal aberrations in the four medulloblastoma subgroups. Array-CGH and SNP data were scored for loss (green), gain (red), or no change (gray) for all chromosomal arms. Results were plotted as frequencies at which these aberrations occurred within each molecular subgroup. P values on the right indicate whether there was a significant difference in the distribution of these frequencies across the four subgroups (Chi-square test). NS not significant
Fig. 3
Fig. 3
Overall survival (OS) analyses of molecular, clinical, and histological subgroups within the gene expression profiling cohort using Kaplan–Meier plots and log-rank tests. OS analysis of molecular subgroups among all patients (a), infants (b), children (c), and adults (d). OS analysis of metastasized (M1–M4, indicated as M+) versus non-metastasized (M0) cases, plotted for all patients (e), infants (f), children (g), and adults (h). OS analyses of classic, desmoplastic and LCA histological subgroups among all patients (i), infants (j), children (k), and adults (l). OS analysis of metastasized (M1–M4, indicated as M+) versus non-metastasized (M0) cases, plotted for each molecular subgroup: WNT (m), SHH (n), Group 3 (o), and Group 4 (p). OS analyses of classic, desmoplastic and LCA histological subgroups plotted for each molecular subgroup: WNT (q), SHH (r), Group 3 (s), and Group 4 (t). Numbers on the Y axis indicate the fraction of surviving patients. Numbers on the X axis indicate the follow-up time in months. NS not significant
Fig. 4
Fig. 4
Overall survival (OS) analyses of cytogenetic subgroups using Kaplan–Meier plots and log-rank tests for statistical significance. Data are shown for all patients within the gene expression profiling cohort, for the SHH subgroup, for Group 3, and for Group 4. OS analysis of patients having a MYC or MYCN amplification versus patients not having these amplifications. eh OS analysis of patients harboring 10q loss versus patients with a balanced 10q. il OS analysis of patients harboring 17p loss versus patients with a balanced 17p. mp OS analysis of patients harboring 17q gain versus patients with a balanced 17q. qr OS analysis of patients harboring 3q gain versus patients with a balanced 3q. Frequency of 3q gain within Group 3 and Group 4 was too low to perform survival analyses. Numbers on the Y axis indicate the fraction of surviving patients. Numbers on the X axis indicate the follow-up time in months. NS not significant

Similar articles

  • Rapid diagnosis of medulloblastoma molecular subgroups.
    Schwalbe EC, Lindsey JC, Straughton D, Hogg TL, Cole M, Megahed H, Ryan SL, Lusher ME, Taylor MD, Gilbertson RJ, Ellison DW, Bailey S, Clifford SC. Schwalbe EC, et al. Clin Cancer Res. 2011 Apr 1;17(7):1883-94. doi: 10.1158/1078-0432.CCR-10-2210. Epub 2011 Feb 16. Clin Cancer Res. 2011. PMID: 21325292 Free PMC article.
  • Medulloblastoma comprises four distinct molecular variants.
    Northcott PA, Korshunov A, Witt H, Hielscher T, Eberhart CG, Mack S, Bouffet E, Clifford SC, Hawkins CE, French P, Rutka JT, Pfister S, Taylor MD. Northcott PA, et al. J Clin Oncol. 2011 Apr 10;29(11):1408-14. doi: 10.1200/JCO.2009.27.4324. Epub 2010 Sep 7. J Clin Oncol. 2011. PMID: 20823417 Free PMC article.
  • Subgroup-specific alternative splicing in medulloblastoma.
    Dubuc AM, Morrissy AS, Kloosterhof NK, Northcott PA, Yu EP, Shih D, Peacock J, Grajkowska W, van Meter T, Eberhart CG, Pfister S, Marra MA, Weiss WA, Scherer SW, Rutka JT, French PJ, Taylor MD. Dubuc AM, et al. Acta Neuropathol. 2012 Apr;123(4):485-499. doi: 10.1007/s00401-012-0959-7. Epub 2012 Feb 23. Acta Neuropathol. 2012. PMID: 22358458 Free PMC article.
  • Molecular Subgrouping of Medulloblastoma: Impact Upon Research and Clinical Practice.
    Gupta T, Shirsat N, Jalali R. Gupta T, et al. Curr Pediatr Rev. 2015;11(2):106-19. doi: 10.2174/1573396311666150702104030. Curr Pediatr Rev. 2015. PMID: 26133181 Review.
  • Risk stratification of childhood medulloblastoma in the molecular era: the current consensus.
    Ramaswamy V, Remke M, Bouffet E, Bailey S, Clifford SC, Doz F, Kool M, Dufour C, Vassal G, Milde T, Witt O, von Hoff K, Pietsch T, Northcott PA, Gajjar A, Robinson GW, Padovani L, André N, Massimino M, Pizer B, Packer R, Rutkowski S, Pfister SM, Taylor MD, Pomeroy SL. Ramaswamy V, et al. Acta Neuropathol. 2016 Jun;131(6):821-31. doi: 10.1007/s00401-016-1569-6. Epub 2016 Apr 4. Acta Neuropathol. 2016. PMID: 27040285 Free PMC article. Review.

Cited by

References

    1. Cho YJ, Tsherniak A, Tamayo P, Santagata S, Ligon A, Greulich H, Berhoukim R, Amani V, Goumnerova L, Eberhart CG, Lau CC, Olson JM, Gilbertson RJ, Gajjar A, Delattre O, Kool M, Ligon K, Meyerson M, Mesirov JP, Pomeroy SL. Integrative genomic analysis of medulloblastoma identifies a molecular subgroup that drives poor clinical outcome. J Clin Oncol. 2011;29(11):1424–1430. doi: 10.1200/JCO.2010.28.5148. - DOI - PMC - PubMed
    1. Clifford SC, Lusher ME, Lindsey JC, Langdon JA, Gilbertson RJ, Straughton D, Ellison DW. Wnt/Wingless pathway activation and chromosome 6 loss characterize a distinct molecular sub-group of medulloblastomas associated with a favorable prognosis. Cell Cycle. 2006;5(22):2666–2670. doi: 10.4161/cc.5.22.3446. - DOI - PubMed
    1. Ellison DW, Dalton J, Kocak M, Nicholson SL, Fraga C, Neale G, Kenney AM, Brat DJ, Perry A, Yong WH, Taylor RE, Bailey S, Clifford SC, Gilbertson RJ. Medulloblastoma: clinicopathological correlates of SHH, WNT, and non-SHH/WNT molecular subgroups. Acta Neuropathol. 2011;121(3):381–396. doi: 10.1007/s00401-011-0800-8. - DOI - PMC - PubMed
    1. Ellison DW, Onilude OE, Lindsey JC, Lusher ME, Weston CL, Taylor RE, Pearson AD, Clifford SC. Beta-Catenin status predicts a favorable outcome in childhood medulloblastoma: the United Kingdom Children’s Cancer Study Group Brain Tumour Committee. J Clin Oncol. 2005;23(31):7951–7957. doi: 10.1200/JCO.2005.01.5479. - DOI - PubMed
    1. Fattet S, Haberler C, Legoix P, Varlet P, Lellouch-Tubiana A, Lair S, Manie E, Raquin MA, Bours D, Carpentier S, Barillot E, Grill J, Doz F, Puget S, Janoueix-Lerosey I, Delattre O. Beta-catenin status in paediatric medulloblastomas: correlation of immunohistochemical expression with mutational status, genetic profiles, and clinical characteristics. J Pathol. 2009;218(1):86–94. doi: 10.1002/path.2514. - DOI - PubMed

Publication types

MeSH terms