c-Fos Expression in the Nucleus of the Solitary Tract in Response to Salt Stimulation in Rats
- PMID: 22359483
- PMCID: PMC3282233
- DOI: 10.4196/kjpp.2011.15.6.437
c-Fos Expression in the Nucleus of the Solitary Tract in Response to Salt Stimulation in Rats
Abstract
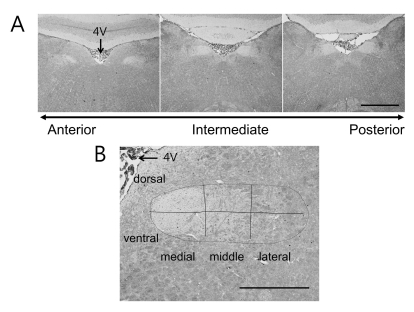
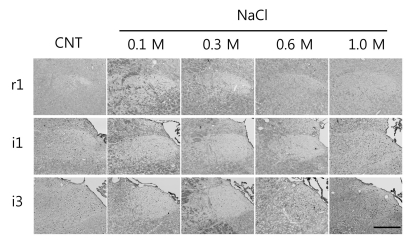
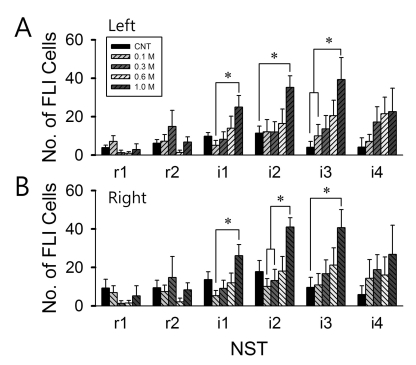
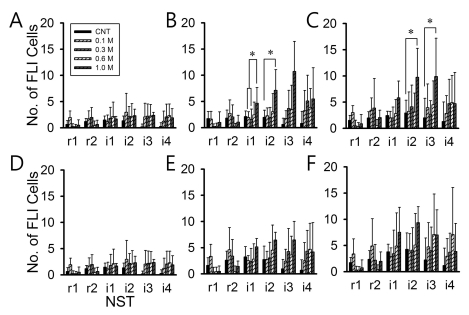
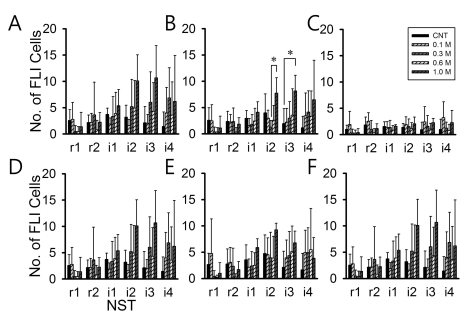
Salt signals in tongue are relayed to the nucleus of the solitary tract (NST). This signaling is very important to determine whether to swallow salt-related nutrition or not and suggests some implications in discrimination of salt concentration. Salt concentration-dependent electrical responses in the chorda tympani and the NST were well reported. But salt concentration-dependency and spatial distribution of c-Fos in the NST were not well established. In the present study, NaCl signaling in the NST was studied in urethane-anesthetized rats. The c-Fos immunoreactivity in the six different NST areas along the rostral-caudal axis and six subregions in each of bilateral NST were compared between applications of distilled water and different concentrations of NaCl to the tongue of experimental animals. From this study, salt stimulation with high concentration (1.0 M NaCl) induced significantly higher c-Fos expression in intermediate NST and dorsal-medial and dorsal-middle subregions of the NST compared to distilled water stimulation. The result represents the specific spatial distribution of salt taste perception in the NST.
Keywords: Chorda tympani nerve; Nucleus of the solitary tract; Salt; c-Fos.
Figures
Similar articles
-
Different spatial expressions of c-Fos in the nucleus of the solitary tract following taste stimulation with sodium, potassium, and ammonium ions in rats.J Neurosci Res. 2015 Feb;93(2):340-9. doi: 10.1002/jnr.23485. Epub 2014 Sep 22. J Neurosci Res. 2015. PMID: 25243715
-
Chorda tympani nerve stimulation evokes Fos expression in regionally limited neuron populations within the gustatory nucleus of the solitary tract.Brain Res. 2001 Jun 15;904(1):54-66. doi: 10.1016/s0006-8993(01)02449-0. Brain Res. 2001. PMID: 11516411
-
Convergence in mammalian nucleus of solitary tract during development and functional differentiation of salt taste circuits.J Neurosci. 1990 Sep;10(9):3148-57. doi: 10.1523/JNEUROSCI.10-09-03148.1990. J Neurosci. 1990. PMID: 2398375 Free PMC article.
-
Excitatory and inhibitory modulation of taste responses in the hamster brainstem.Ann N Y Acad Sci. 1998 Nov 30;855:450-6. doi: 10.1111/j.1749-6632.1998.tb10605.x. Ann N Y Acad Sci. 1998. PMID: 9929638 Review.
-
Neurotransmitters and Receptors Expressed by rNST Neurons.In: Bradley RM, editor. The Role of the Nucleus of the Solitary Tract in Gustatory Processing. Boca Raton (FL): CRC Press/Taylor & Francis; 2007. Chapter 3. In: Bradley RM, editor. The Role of the Nucleus of the Solitary Tract in Gustatory Processing. Boca Raton (FL): CRC Press/Taylor & Francis; 2007. Chapter 3. PMID: 21204467 Free Books & Documents. Review.
Cited by
-
Effects of acupuncture stimulation at different acupoints on formalin-induced pain in rats.Korean J Physiol Pharmacol. 2014 Apr;18(2):121-7. doi: 10.4196/kjpp.2014.18.2.121. Epub 2014 Apr 3. Korean J Physiol Pharmacol. 2014. PMID: 24757373 Free PMC article.
-
MSG-Evoked c-Fos Activity in the Nucleus of the Solitary Tract Is Dependent upon Fluid Delivery and Stimulation Parameters.Chem Senses. 2016 Mar;41(3):211-20. doi: 10.1093/chemse/bjv082. Epub 2016 Jan 13. Chem Senses. 2016. PMID: 26762887 Free PMC article.
-
Subdiaphragmatic vagotomy reduces intake of sweet-tasting solutions in rats.Neural Regen Res. 2013 Jun 15;8(17):1560-7. doi: 10.3969/j.issn.1673-5374.2013.17.003. Neural Regen Res. 2013. PMID: 25206451 Free PMC article.
References
-
- Paxinos G. The Rat Nervous System. 3rd ed. San Diego: Elsevier Academic Press; 2004.
-
- Hamilton RB, Norgren R. Central projections of gustatory nerves in the rat. J Comp Neurol. 1984;222:560–577. - PubMed
-
- Morton GJ, Cummings DE, Baskin DG, Barsh GS, Schwartz MW. Central nervous system control of food intake and body weight. Nature. 2006;443:289–295. - PubMed
-
- Herrera DG, Robertson HA. Activation of c-fos in the brain. Prog Neurobiol. 1996;50:83–107. - PubMed