. 2012 Feb;8(2):e1002536.
doi: 10.1371/journal.ppat.1002536. Epub 2012 Feb 16.

Efficient capture of infected neutrophils by dendritic cells in the skin inhibits the early anti-leishmania response

Affiliations

Efficient capture of infected neutrophils by dendritic cells in the skin inhibits the early anti-leishmania response

Flavia L Ribeiro-Gomes et al. PLoS Pathog. 2012 Feb.

Abstract

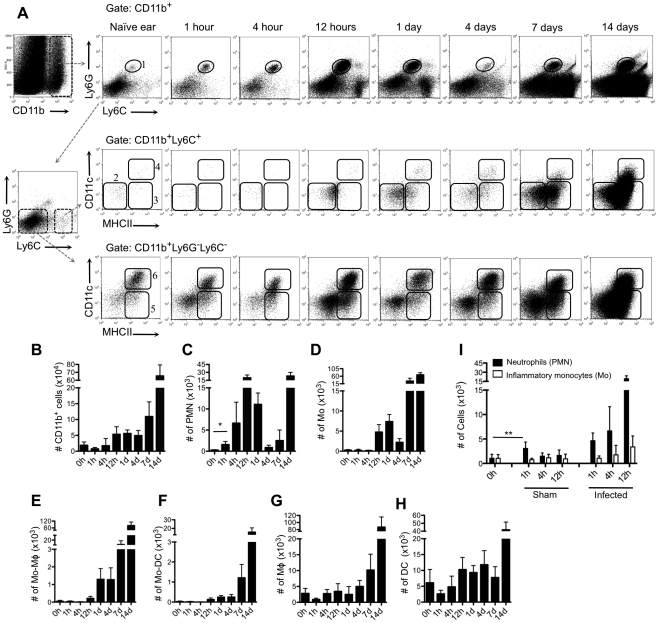
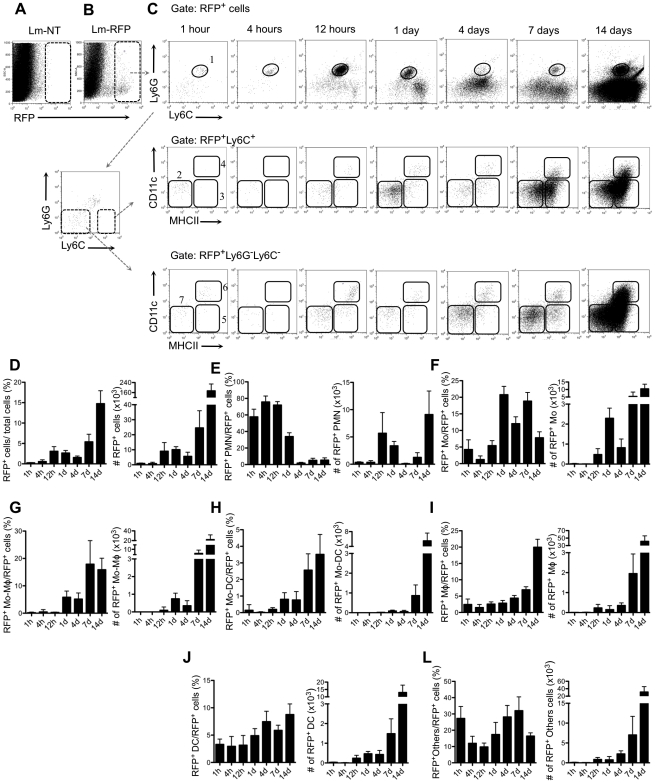
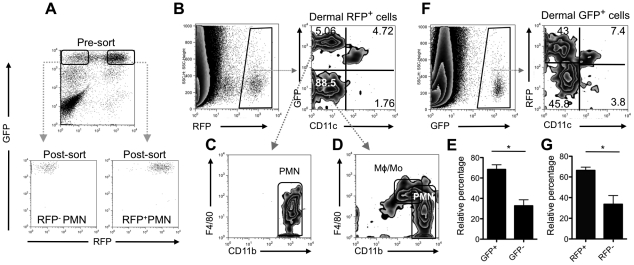
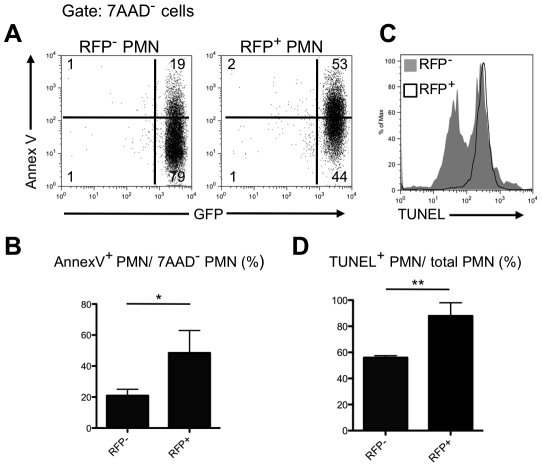
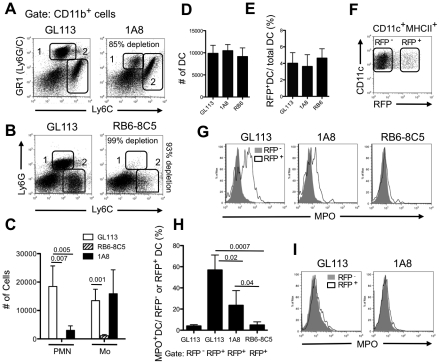
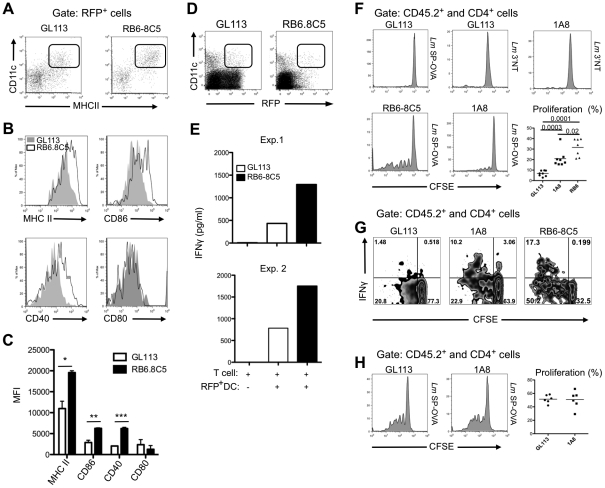
Neutrophils and dendritic cells (DCs) converge at localized sites of acute inflammation in the skin following pathogen deposition by the bites of arthropod vectors or by needle injection. Prior studies in mice have shown that neutrophils are the predominant recruited and infected cells during the earliest stage of Leishmania major infection in the skin, and that neutrophil depletion promotes host resistance to sand fly transmitted infection. How the massive influx of neutrophils aimed at wound repair and sterilization might modulate the function of DCs in the skin has not been previously addressed. The infected neutrophils recovered from the skin expressed elevated apoptotic markers compared to uninfected neutrophils, and were preferentially captured by dermal DCs when injected back into the mouse ear dermis. Following challenge with L. major directly, the majority of the infected DCs recovered from the skin at 24 hr stained positive for neutrophil markers, indicating that they acquired their parasites via uptake of infected neutrophils. When infected, dermal DCs were recovered from neutrophil depleted mice, their expression of activation markers was markedly enhanced, as was their capacity to present Leishmania antigens ex vivo. Neutrophil depletion also enhanced the priming of L. major specific CD4(+) T cells in vivo. The findings suggest that following their rapid uptake by neutrophils in the skin, L. major exploits the immunosuppressive effects associated with the apoptotic cell clearance function of DCs to inhibit the development of acquired resistance until the acute neutrophilic response is resolved.


Conflict of interest statement

The authors have declared that no competing interests exist.

Figures

Figure 1
Figure 1. Kinetics of myeloid cell recruitment following i.d. inoculation of L. major.
(A) Representative dot plots of ear-derived dermal cells recovered at different times after i.d. infection with 2×10⁵ Lm-RFP. Subpopulations of CD11b+ myeloid cells are defined by the following markers: Ly6CintLy6G+ neutrophils (PMN; region 1); Ly6ChiLy6G inflammatory monocytes (Mo; region 2) Ly6ChiLy6GCD11cMHCII+ monocytes/macrophages (Mo-Mφ; region 3); Ly6ChiLy6GCD11c+MHCII+ monocyte-derived dendritic cells (Mo-DC; region 4); Ly6CLy6GCD11cMHCII+ macrophages (Mφ; region 5); Ly6CLy6GCD11c+MHCII+ dendritic cells (DC; region 6). (B–H) Changes in the total number of CD11b+ cells, PMN, Mo, Mo-Mφ, Mo-DC, Mφ, and DC per ear. Values shown are the mean numbers of cells per ear +/− 1 s.d., 6–8 ears at each time point, pooled data from two independent experiments. * p = 0.0006. (I) Total number of ear-derived neutrophils and inflammatory monocytes in sham and Lm-RFP injected mice. Values shown are the mean numbers of cells per ear +/− 1 s.d., 6–8 ears at each time point, pooled data from two independent experiments. ** p = 0.0174.
Figure 2
Figure 2. Kinetics of inflammatory cell subsets infected by L. major.
(A–B) SSC/RFP dot plots of ear-derived cells 1 hr post-infection with 2×10⁵ L. major- vector control (Lm-NT) (A) or L. major-RFP (Lm-RFP) (B). (C) Representative dot plots of RFP+ ear-derived cell subsets at different time points after i.d. infection with Lm-RFP. Regions 1–6 define the same subsets of CD11b+ myeloid cells as defined in the corresponding regions in Figure 1A. Region 7 (others) delineates a poorly defined Ly6GLy6CCD11cMHCII population that includes CD11b+ and CD11b cells. (D) Changes in the RFP+ cells expressed as a percentage of total ear dermal cells, and their absolute numbers recovered at each time point. (E–L) Changes in the subsets of RFP+ cells expressed as a percentage of the total RFP+ cells, and their absolute numbers recovered at each time point. Values shown are the mean numbers of cells per ear +/− 1 s.d., 6–8 ears at each time point, pooled data from two independent experiments.
Figure 3
Figure 3. Uptake of infected neutrophils by dermal DCs.
(A) LYS-eGFPhi neutrophils recovered from the ear dermis 12 hrs after infection with 2×10⁶ Lm-RFP metacyclic promastigtoes were sorted to obtain uninfected RFP and infected RFP+ neutrophils. (B–D) Representative dot plots of gated RFP+ dermal cells recovered from a single ear of a C57BL/6 mouse 4 hr after i.d. injection of 2.5×10⁴ RFP+ neutrophils, and analyzed for their expression of eGFP, CD11c, F4/80 and CD11b. Quadrant values are the percentage of total RFP+ cells. (E) RFP+ DCs that are eGFP+ or eGFP (mean percentage +/− 1 s.d.), calculated from the analysis shown in (B) involving 4 independent experiments, 1–2 ears per experiment; * P<0.0001. (F) Representative dot plots of gated eGFP+ dermal cells recovered from a single ear of a C57BL/6 mouse 4 hr after i.d. injection of 2.5×10⁴ of uninfected RFP and 2.5×10⁴ infected RFP+ neutrophils and analyzed for their expression of RFP and CD11c. Quadrant values are the percentage of total eGFP+ cells. (G) Total eGFP+ DC that are RFP+ or RFP (mean percentage +/− 1 s.d.), calculated from the analysis shown in (F) involving 4 independent experiments, 1 ear per experiment; * P<0.0001.
Figure 4
Figure 4. Uptake of L. major leads to accelerated apoptosis of neutrophils in the skin.
(A) Representative dot plots of sorted RFP or RFP+ LYS-eGFPhi neutrophils recovered from the ear dermis 12 hrs after infection with 2×10⁶ Lm-RFP metacyclic promastigotes and stained with annexin V-APC after gating on 7-AAD cells. Quadrant values show the percentage of total gated cells. (B) Annexin-V+ 7-AAD cells (mean percentage +/− 1 s.d.) calculated from 3 independent experiments; * p = 0.034. (C) Representative histogram plot of RFP (gray filled) and RFP+ (black line) neutrophils subjected to TUNEL staining. (D) TUNEL+ cells (mean percentage +/− 1 s.d.) calculated from 2 independent experiments; ** p = 0.047.
Figure 5
Figure 5. Dermal DCs infected with L. major display neutrophil markers.
Mice were treated with control (GL113) or neutrophil-depleting (RB6-8C5 or 1A8) monoclonal antibodies 1 d before challenge in the ear dermis with 2×10⁵ Lm-RFP metacyclic promastigotes. (A) Representative dot plots of CD11b+GR-1hiLy6Cint neutrophils (region 1) and CD11b+GR1intLy6Chi inflammatory monocytes (region 2) in the GL113 or 1A8 treated mice. (B) Representative dot plots of CD11b+Ly6G+Ly6Cint neutrophils (region 1) and CD11b+Ly6GLy6Chi inflammatory monocytes in the GL113 or RB6-8C5 depleted mice (region 2). (C) Mean total number per ear of neutrophils (PMN) or inflammatory monocytes (Mo) in neutrophil depleted or control treated, infected mice, +/− 1 s.d., 4–6 ears per group pooled from 2 independent experiments. (D–E) Mean total number of DCs (CD11c+MHCII+) per ear (D) and the mean percentage of RFP+ DCs per ear (E) 1 d after infection, +/− 1 s.d., 8–10 ears per group, pooled from 3 independent experiments. (F) Representative dot plot of CD11c+MHCII+-gated RFP uninfected and RFP+ infected dermal DCs, 24 hr after infection. (G) Representative histogram plots of MPO stained, RFP (gray filled) and RFP+ (black line) DCs 24 hr after infection. (H) Mean percentage of RFP or RFP+ DCs staining positive for MPO, +/− 1 s.d., 4 ears per group, pooled from two independent experiments. (I) Representative histogram plots of MPO stained, RFP (gray filled) and RFP+ (black line) DCs. Mice were treated with control or neutrophil-depleting antibodies 1 d before i.d. challenge and the dermal cells were analyzed 14 days after infection.
Figure 6
Figure 6. Effects of neutrophil depletion on the activation and function of dermal DCs ex vivo, and on CD4+ T cell priming in vivo.
(A) Representative dot plots of RFP+ DCs recovered 3 d after i.d. infection with 2×10⁶ Lm-RFP metacyclic promastigotes in mice treated with GL113 or RB6-8C5 1 d before challenge. (B) Representative histogram plots of RFP+CD11c+MHCII+ gated cells from control treated (gray filled) and RB6-8C5 treated (black line) infected mice stained for MHCII, CD86, CD40 and CD80. (C) Mean fluorescence intensity (MFI) of MHCII, CD86, CD40 and CD80 expression on RFP+CD11c+MHCII+ gated cells from control treated (white bars) and RB6-8C5 treated (black bars) infected mice; mean percentage +/− 1 s.d. calculated from 2 independent experiments; * p = 0.0214, ** p = 0.0134, *** p = 0.0025. (D) Representative dot plots showing the gates used for sorting of the RFP+CD11c+ dermal cells recovered from control and RB6-8C5 treated, infected mice. (E) IFN-γ levels in supernatants of T cells from healed, L. major-infected mice co-cultured for 3 d with sorted RFP+CD11c+ cells recovered from the ears of control treated or RB6-8C5 treated mice 3 days after i.d. infection with 2×10⁶ Lm-RFP metacyclic promastigotes. Two independent experiments are shown. (F–H) B6.SJL mice were treated with GL113, RB6-8C5 or 1A8 mAb followed 1 d later by i.d. inoculation with 105 Lm SP-OVA or Lm 3′NT metacyclic promastigotes. CFSE-labeled CD4+ OT-II cells were adoptively transferred at the time of (F–G) or 2 weeks after infection (F). Shown are representative dot and histogram plots of IFN-γ expression and/or CFSE fluorescence of CD45.2+CD4+ gated cells from the draining lymph nodes 6 days after transfer, and the proliferative response with means of CD4+ OT-II cells from individual mice, as defined by the percent of cells with reduced CFSE content. The data are pooled from two independent experiments.

Similar articles

Cited by

References

    1. Sacks D, Anderson C. Re-examination of the immunosuppressive mechanisms mediating non-cure of Leishmania infection in mice. Immunol Rev. 2004;201:225–238. - PubMed
    1. Belkaid Y, Mendez S, Lira R, Kadambi N, Milon G, et al. A natural model of Leishmania major infection reveals a prolonged “silent” phase of parasite amplification in the skin before the onset of lesion formation and immunity. J Immunol. 2000;165:969–977. - PubMed
    1. Laskay T, van Zandbergen G, Solbach W. Neutrophil granulocytes as host cells and transport vehicles for intracellular pathogens: apoptosis as infection-promoting factor. Immunobiology. 2008;213:183–191. - PubMed
    1. Peters NC, Sacks DL. The impact of vector-mediated neutrophil recruitment on cutaneous leishmaniasis. Cell Microbiol. 2009;11:1290–1296. - PMC - PubMed
    1. Peters NC, Egen JG, Secundino N, Debrabant A, Kimblin N, et al. In vivo imaging reveals an essential role for neutrophils in leishmaniasis transmitted by sand flies. Science. 2008;321:970–974. - PMC - PubMed

Publication types