

Comparison of marine spatial planning methods in Madagascar demonstrates value of alternative approaches
- PMID: 22359534
- PMCID: PMC3281012
- DOI: 10.1371/journal.pone.0028969
Comparison of marine spatial planning methods in Madagascar demonstrates value of alternative approaches
Abstract
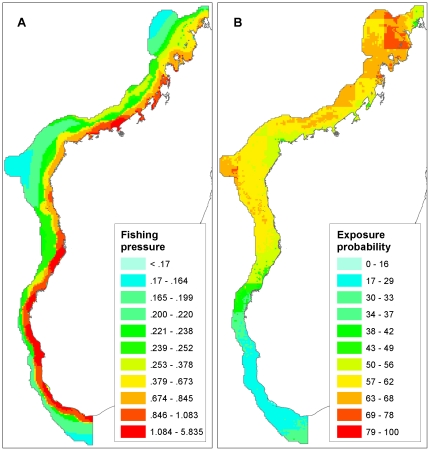
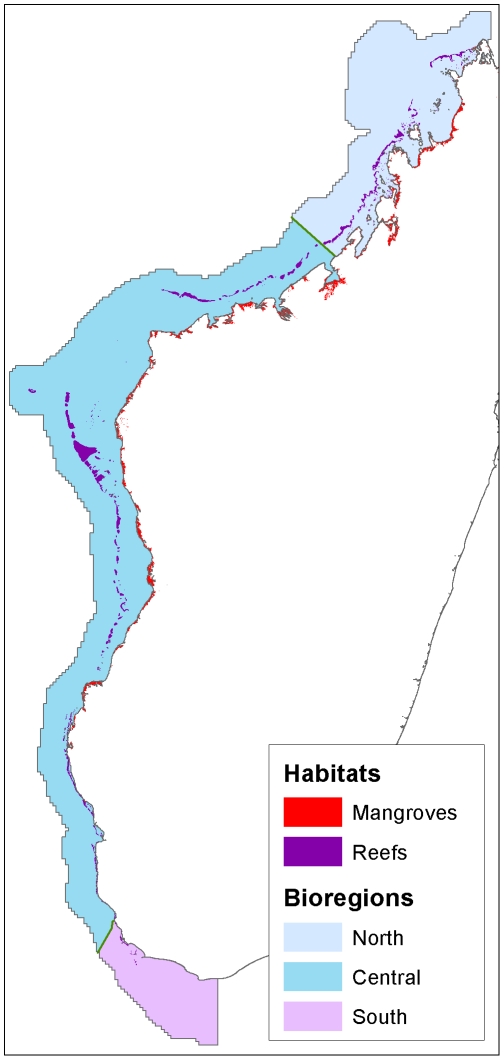
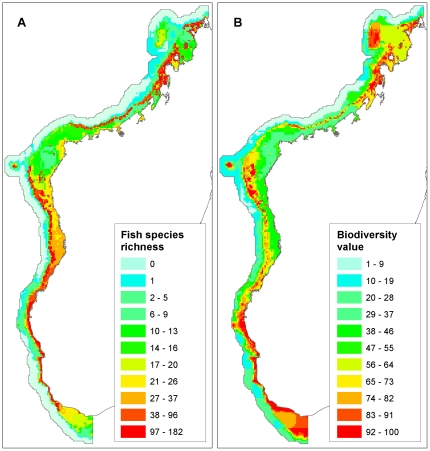
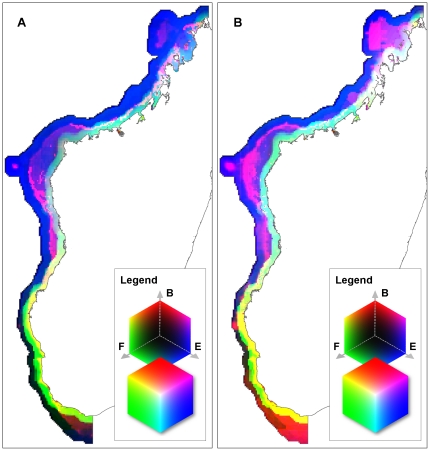
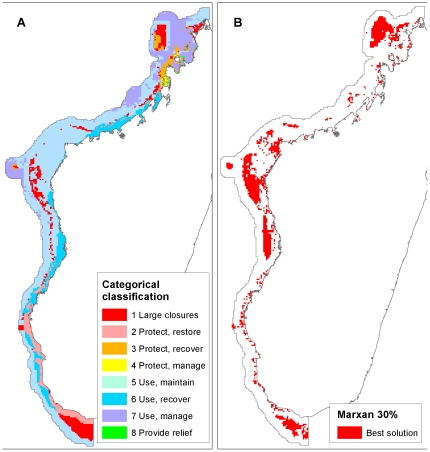
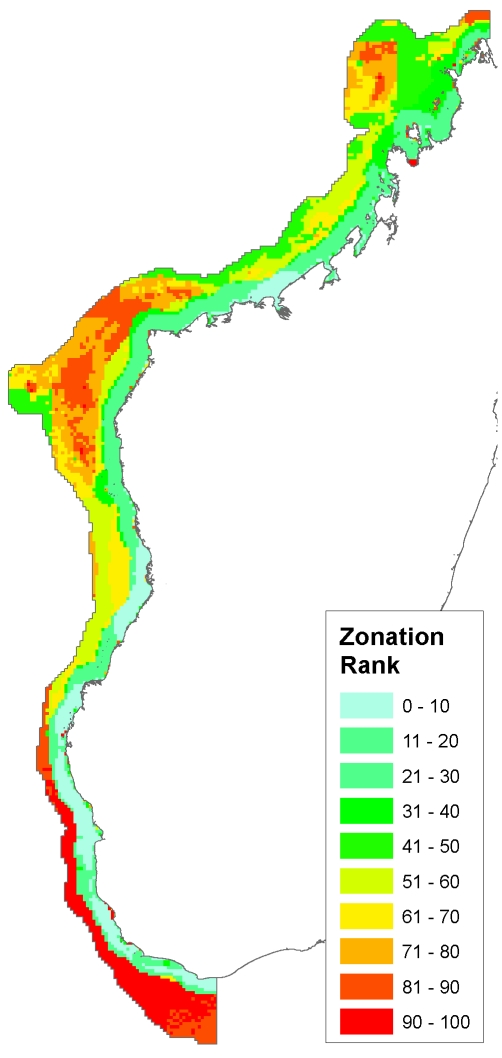
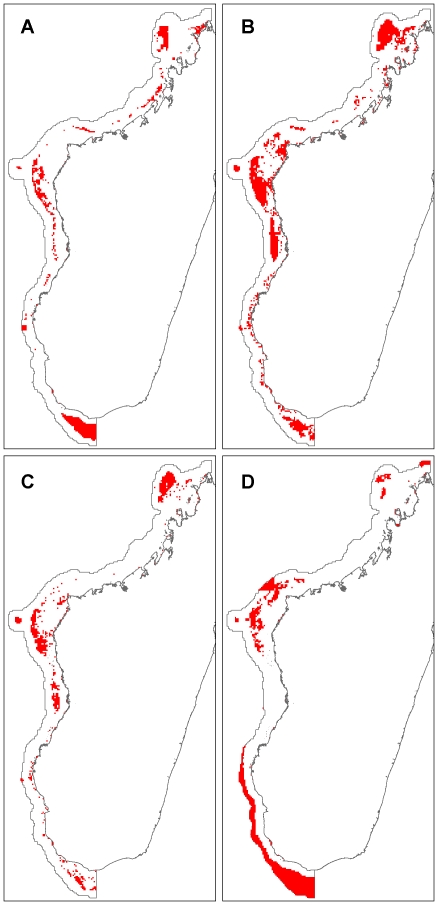
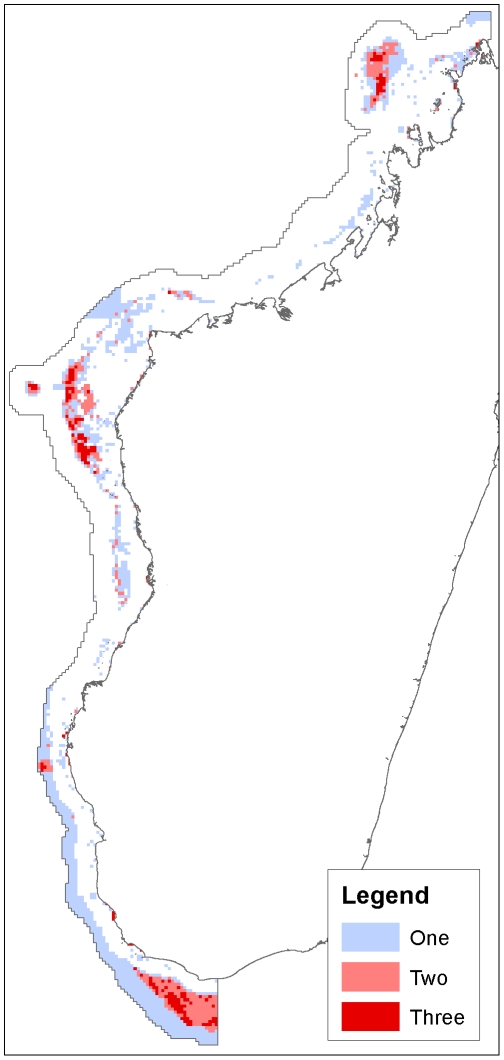
The Government of Madagascar plans to increase marine protected area coverage by over one million hectares. To assist this process, we compare four methods for marine spatial planning of Madagascar's west coast. Input data for each method was drawn from the same variables: fishing pressure, exposure to climate change, and biodiversity (habitats, species distributions, biological richness, and biodiversity value). The first method compares visual color classifications of primary variables, the second uses binary combinations of these variables to produce a categorical classification of management actions, the third is a target-based optimization using Marxan, and the fourth is conservation ranking with Zonation. We present results from each method, and compare the latter three approaches for spatial coverage, biodiversity representation, fishing cost and persistence probability. All results included large areas in the north, central, and southern parts of western Madagascar. Achieving 30% representation targets with Marxan required twice the fish catch loss than the categorical method. The categorical classification and Zonation do not consider targets for conservation features. However, when we reduced Marxan targets to 16.3%, matching the representation level of the "strict protection" class of the categorical result, the methods show similar catch losses. The management category portfolio has complete coverage, and presents several management recommendations including strict protection. Zonation produces rapid conservation rankings across large, diverse datasets. Marxan is useful for identifying strict protected areas that meet representation targets, and minimize exposure probabilities for conservation features at low economic cost. We show that methods based on Zonation and a simple combination of variables can produce results comparable to Marxan for species representation and catch losses, demonstrating the value of comparing alternative approaches during initial stages of the planning process. Choosing an appropriate approach ultimately depends on scientific and political factors including representation targets, likelihood of adoption, and persistence goals.
Conflict of interest statement
Figures
References
-
- Worm B, Barbier EB, Beaumont N, Duffy JE, Folke C, et al. Impacts of biodiversity loss on ocean ecosystem services. Science. 2006;314:787–790. - PubMed
-
- Botsford LW, Castilla JC, Peterson CH. The Management of fisheries and marine ecosystems. Science. 1997;277:509–515.
-
- Worm B, Hilborn R, Baum JK, Branch TA, Collie JS, et al. Rebuilding global fisheries. Science. 2009;325:578–585. - PubMed
-
- McClanahan TR, Graham NAJ, Calnan JM, MacNeil MA. Toward pristine biomass: reef fish recovery in coral reef marine protected areas in Kenya. Ecological Applications. 2007;17:1055–1067. - PubMed
