. 2012;7(2):e30606.
doi: 10.1371/journal.pone.0030606. Epub 2012 Feb 16.

Effects of inhibiting CoQ10 biosynthesis with 4-nitrobenzoate in human fibroblasts

Affiliations

Effects of inhibiting CoQ10 biosynthesis with 4-nitrobenzoate in human fibroblasts

Catarina M Quinzii et al. PLoS One. 2012.

Abstract

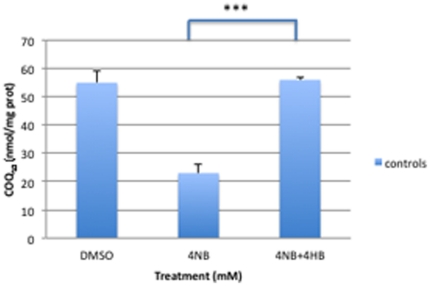
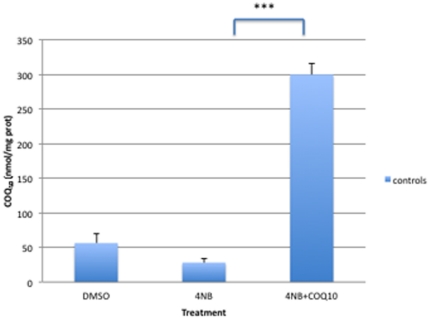
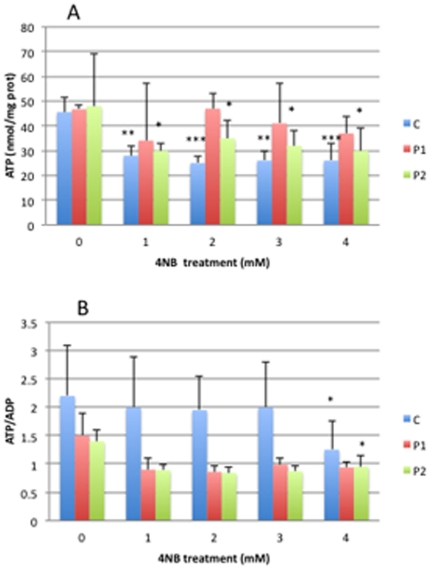
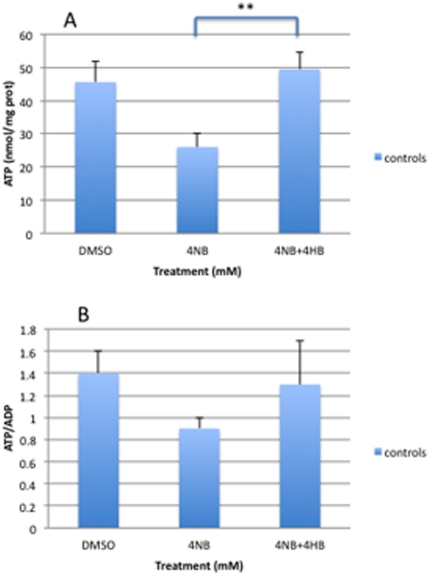
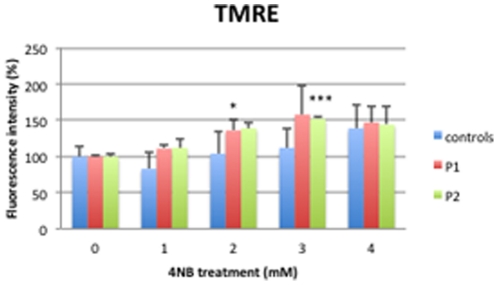
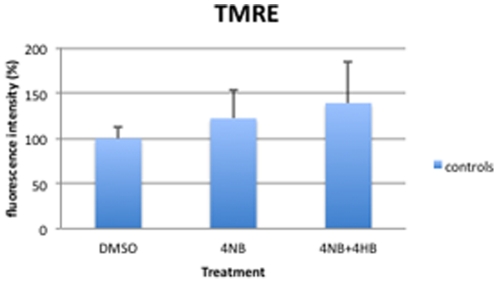
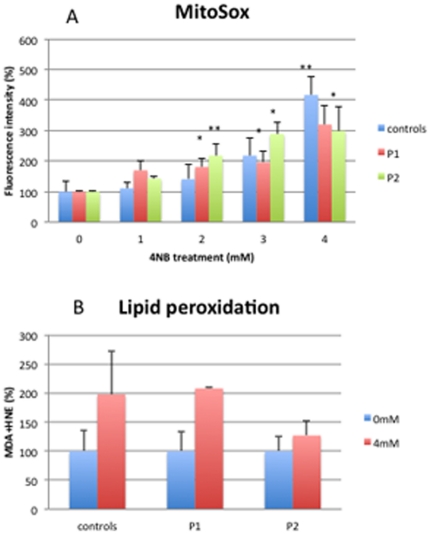
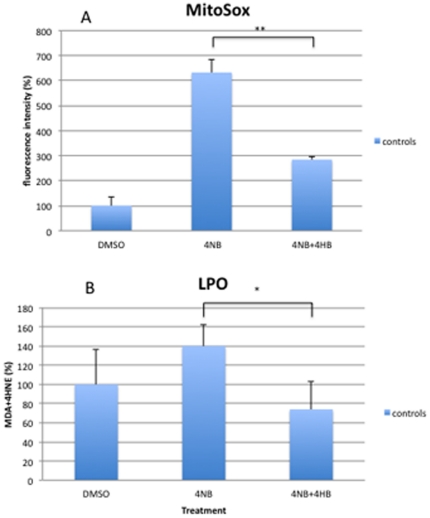
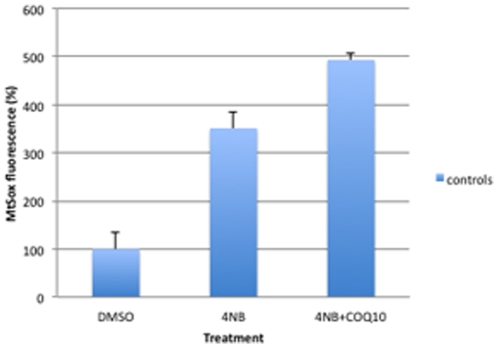
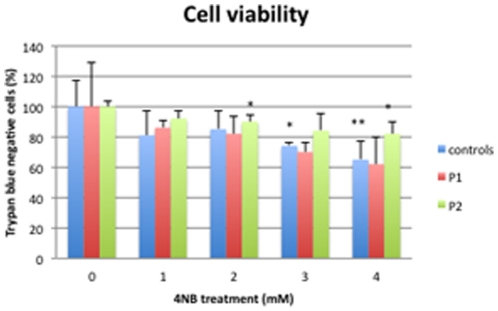
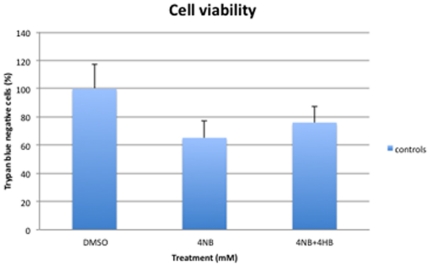
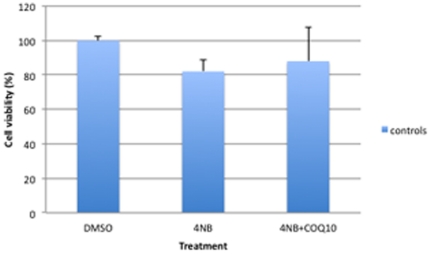
Coenzyme Q(10) (CoQ(10)) is a potent lipophilic antioxidant in cell membranes and a carrier of electrons in the mitochondrial respiratory chain. We previously characterized the effects of varying severities of CoQ(10) deficiency on ROS production and mitochondrial bioenergetics in cells harboring genetic defects of CoQ(10) biosynthesis. We observed a unimodal distribution of ROS production with CoQ(10) deficiency: cells with <20% of CoQ(10) and 50-70% of CoQ(10) did not generate excess ROS while cells with 30-45% of CoQ(10) showed increased ROS production and lipid peroxidation. Because our previous studies were limited to a small number of mutant cell lines with heterogeneous molecular defects, here, we treated 5 control and 2 mildly CoQ(10) deficient fibroblasts with varying doses of 4-nitrobenzoate (4-NB), an analog of 4-hydroxybenzoate (4-HB) and inhibitor of 4-para-hydroxybenzoate:polyprenyl transferase (COQ2) to induce a range of CoQ(10) deficiencies. Our results support the concept that the degree of CoQ(10) deficiency in cells dictates the extent of ATP synthesis defects and ROS production and that 40-50% residual CoQ(10) produces maximal oxidative stress and cell death.


Conflict of interest statement

Competing Interests: The authors have declared that no competing interests exist.

Figures

Figure 1
Figure 1. CoQ10 levels in control (n = 5), P1 and P2 skin fibroblasts after 4-NB treatment.
CoQ10 levels are nmol/mg-protein (*P<0.05 vs. controls).
Figure 2
Figure 2. CoQ10 levels in control skin fibroblasts (n = 5) after treatment with DMSO, 4 mM 4-NB alone, or 4 mM 4-NB+2 mM 4-HB.
The values are nmol/mg-protein (***P<0.001).
Figure 3
Figure 3. CoQ10 levels in control skin fibroblasts (n = 5) after treatment with DMSO, 4 mM 4-NB alone, or 4 mM 4-NB+5 µM CoQ10.
The values are nmol/mg-protein (***P<0.001).
Figure 4
Figure 4. Adenine nucleotides levels in control (n = 5), P1 and P2 skin fibroblasts after 4-NB treatment (ATP in panel A and ATP/ADP in panel B).
The values are nmol/mg-protein, P1 and P2 after 4 mM DMSO treatment. (* P<0.05 vs. controls; **P<0.01 vs. controls; ***P<0.001 vs. controls).
Figure 5
Figure 5. Adenine nucleotides levels in control skin fibroblasts (n = 5) after co-treatment with 4 mM 4-NB+2 mM 4-HB (ATP in panel A and ATP/ADP in panel B).
The values are nmol/mg-protein (** P<0.01 vs. controls; ***P<0.001).
Figure 6
Figure 6. Assessment of mitochondrial membrane potential with TMRE in control (n = 5), P1 and P2 skin fibroblasts after 4-NB treatment.
The values are expressed as percentage of controls, P1 and P2 after 4 mM DMSO treatment. (* P<0.05 vs. controls;***P<0.001 vs. controls).
Figure 7
Figure 7. Assessment of mitochondrial membrane potential by TMRE in control skin fibroblasts (n = 5) after co-treatment with 4 mM 4-NB+2 mM 4-HB.
The values are expressed as percentage of the control skin fibroblasts after 4 mM DMSO.
Figure 8
Figure 8. Quantitation of MitoSox staining by flow cytometry (panel A) and oxidation of lipids (panel B) in control (n = 5), P1 and P2 skin fibroblasts after 4-NB treatment.
The values are expressed as percentage of controls, P1 and P2 after 4 mM DMSO treatment. (***P<0.001 vs. controls).
Figure 9
Figure 9. Quantitation of MitoSox staining by flow cytometry (panel A) and oxidation of lipids (panel B) in control skin fibroblasts (n = 5) after co-treatment with 4 mM 4-NB+2 mM 4-HB.
The values are expressed as percentage of the control skin fibroblasts after 4 mM DMSO (** P<0.01).
Figure 10
Figure 10. Quantitation of MitoSox staining by flow cytometry in control skin fibroblasts (n = 5) after co-treatment with 4 mM 4-NB+5 µM CoQ10.
The values are expressed as percentage of the control skin fibroblasts after 4 mM DMSO (** P<0.01).
Figure 11
Figure 11. Trypan blue staining in control (n = 5), P1 and P2 skin fibroblasts after 4-NB treatment.
The values are expressed as percentage of controls, P1 and P2 after 4 mM DMSO treatment. (* P<0.05 vs. controls; ** P<0.01 vs. controls).
Figure 12
Figure 12. Quantitation of cell viability by trypan blue staining in control skin fibroblasts (n = 5) after co-treatment with 4 mM 4-NB+2 mM 4-HB.
The values are expressed as percentage of the control skin fibroblasts after 4 mM DMSO.
Figure 13
Figure 13. Trypan blue staining in control skin fibroblasts (n = 5) after co-treatment with 4 mM 4-NB+5 µM CoQ10.
The values are expressed as percentage of the control skin fibroblasts after 4 mM DMSO. (* P<0.05 vs. controls; ** P<0.01 vs. controls).

Similar articles

Cited by

References

    1. Bentinger M, Tekle M, Dallner G. Coenzyme Q–biosynthesis and functions. Biochem Biophys Res Commun. 2010;396:74–79. - PubMed
    1. Quinzii CM, Lopez LC, Gilkerson RW, Dorado B, Coku J, et al. Reactive oxygen species, oxidative stress, and cell death correlate with level of CoQ10 deficiency. FASEB J. 2010;24:3733–3743. - PMC - PubMed
    1. Quinzii CM, Lopez LC, Von-Moltke J, Naini A, Krishna S, et al. Respiratory chain dysfunction and oxidative stress correlate with severity of primary CoQ10 deficiency. FASEB J. 2008;22:1874–1885. - PMC - PubMed
    1. Tran UC, Clarke CF. Endogenous synthesis of coenzyme Q in eukaryotes. Mitochondrion. 2007;7(Suppl):S62–71. - PMC - PubMed
    1. Kawamukai M. Biosynthesis and bioproduction of coenzyme Q10 by yeasts and other organisms. Biotechnol Appl Biochem. 2009;53:217–226. - PubMed

Publication types