. 2012;7(2):e30629.
doi: 10.1371/journal.pone.0030629. Epub 2012 Feb 16.

Exon-specific QTLs skew the inferred distribution of expression QTLs detected using gene expression array data

Affiliations

Exon-specific QTLs skew the inferred distribution of expression QTLs detected using gene expression array data

Jean-Baptiste Veyrieras et al. PLoS One. 2012.

Abstract

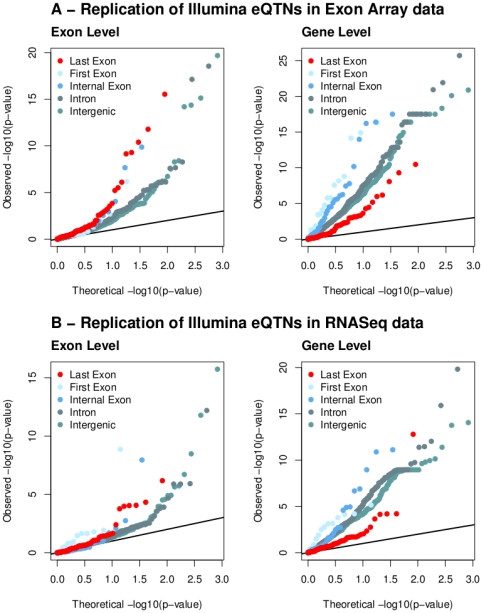
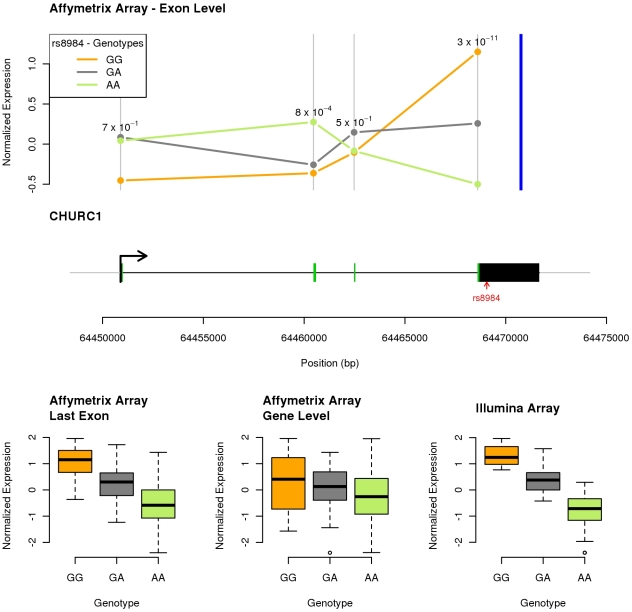
Mapping of expression quantitative trait loci (eQTLs) is an important technique for studying how genetic variation affects gene regulation in natural populations. In a previous study using Illumina expression data from human lymphoblastoid cell lines, we reported that cis-eQTLs are especially enriched around transcription start sites (TSSs) and immediately upstream of transcription end sites (TESs). In this paper, we revisit the distribution of eQTLs using additional data from Affymetrix exon arrays and from RNA sequencing. We confirm that most eQTLs lie close to the target genes; that transcribed regions are generally enriched for eQTLs; that eQTLs are more abundant in exons than introns; and that the peak density of eQTLs occurs at the TSS. However, we find that the intriguing TES peak is greatly reduced or absent in the Affymetrix and RNA-seq data. Instead our data suggest that the TES peak observed in the Illumina data is mainly due to exon-specific QTLs that affect 3' untranslated regions, where most of the Illumina probes are positioned. Nonetheless, we do observe an overall enrichment of eQTLs in exons versus introns in all three data sets, consistent with an important role for exonic sequences in gene regulation.


Conflict of interest statement

Competing Interests: JBV worked as a consultant on this project via his self-employed company Biominglabs and has nothing to declare regarding any patents, products in development or marketed products etc in connection with the study. This does not alter the authors' adherence to all the PLoS ONE policies on sharing data and materials.

Figures

Figure 1
Figure 1. Expression QTN distributions estimated using three different technologies for measuring gene expression.
The left-hand column plots the distribution of locations of most significant SNPs for each technology; the red arrows indicate the location of the TES peak observed in the Illumina data. SNPs outside genes are assigned to bins based on their physical distance from the TSS (for upstream SNPs), or TES (downstream SNPs). SNPs inside genes are assigned to bins based on their fractional location within the gene. The plotted gene size is the average gene length in the data. To provide a formal comparison among different models, the right-hand column displays the difference in Akaike Information Criterion (AIC) values between different parameterizations of our Bayesian hierarchical model (see Methods and Table 1). Small values of formula image
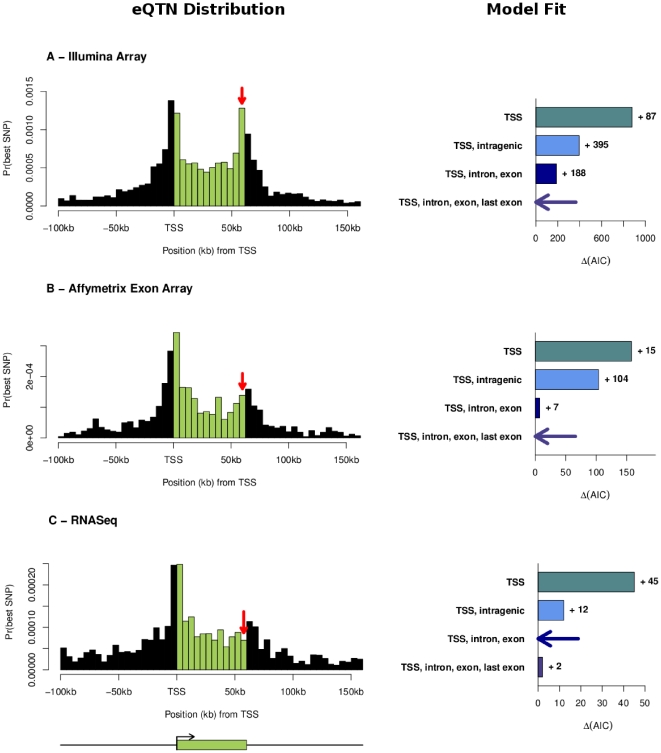
“(AIC”) indicate better model fit, and the best model for each data set is indicated with a horizontal arrow. The labels for the four models indicate the different parameters included in each model: “TSS” refers to our basic distance model measured as distance from TSS; “intragenic” means that we use a single additional parameter for all SNPs within the transcript; “exon, intron” indicates that we use separate parameters for exonic and intronic SNPs respectively, and “last exon” indicates that we add an additional parameter for SNPs in the final exon.
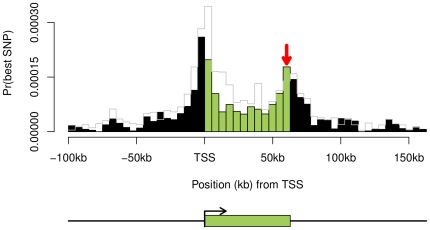
Figure 2
Figure 2. Expression QTN distribution estimated using only those Affymetrix probes that are located within the same exon as an Illumina probe creates an apparent 3′ signal peak.
Overall, the Affymetrix probes are spread roughly evenly across exons while the Illumina probes are 3′ biased. By analyzing only those Affymetrix probes that are in the same exons as Illumina probes, we create an apparent 3′ signal peak. For the sake of comparison, the grey line represents the original distribution as plotted in Figure 1.
Figure 3
Figure 3. Illumina last exon expression-QTLs are more likely to be splicing-QTLs.
We determined the most significant SNP for each Illumina eQTL, and then tested every such SNP for association at the gene- and exon-levels using the Affymetrix and RNA-seq data. Here we show QQ-plots for these Illumina eQTNs in the exon-level analysis (left) and the gene-level analysis (right), using the Affymetrix exon array data (top) and RNA-seq data (bottom). The color codes correspond to 5 exclusive categories of the Illumina eQTNs with respect to the target gene: intragenic, exonic “(first, internal and last) or intronic (intron). Note that last-exon Illumina eQTNs tend to replicate well at the exon level, but poorly at the gene level, suggesting that these are frequently exon-QTLs but infrequently gene-QTLs.
Figure 4
Figure 4. SNP rs8984, located within the last exon of gene CHURC1, primarily affects expression of the last exon, but is interpreted by the Illumina analysis (which has only one probe in this gene) as a gene level QTL.
For each panel, we display quantile-normalized expression levels. Data for each genotype at SNP rs8984 are repre- sented with the same color code (orange, grey and green) for all the panels. The top panel plots the mean exon expression levels along the gene as measured by the Affymetrix probes and provides on top of each exon the p-value for the association between the exon expression levels and the SNP genotypes. The blue vertical bar indicates the position of the single Illumina probe. The middle panel is a schematic representation of the gene: exons are plotted as black/green rectangles where the green color indicates coding regions. The position of SNP rs8984 is indicated by a red arrow. The bottom panel provides the box plots corresponding to each analysis: from left to right, specific Affymetrix last exon expression levels (p-value = 3×10⁻¹¹), Affymetrix gene expression levels (p-value = 0.04) and Illumina gene expression levels (p-value = 3×10⁻²⁷).

Similar articles

Cited by

References

    1. Wray G. The evolutionary significance of cis-regulatory mutations. Nat Rev Genet. 2007;8:206–216. - PubMed
    1. Cookson W, Liang L, Abecasis G, Moffatt M, Lathrop M. Mapping complex disease traits with global gene expression. Nat Rev Genet. 2009;10:184–194. - PMC - PubMed
    1. Brem R, Yvert G, Clinton R, Kruglyak L. Genetic dissection of transcriptional regulation in budding yeast. Science. 2002;296:752. - PubMed
    1. Morley M, Molony C, Weber T, Devlin J, Ewens K, et al. Genetic analysis of genome-wide variation in human gene expression. Nature. 2004;430:743. - PMC - PubMed
    1. Gilad Y, Rifkin S, Pritchard J. Revealing the architecture of gene regulation: the promise of eQTL studies. Trends Genet. 2008;24:408–415. - PMC - PubMed

Publication types