

Genome-wide association study identified a narrow chromosome 1 region associated with chicken growth traits
- PMID: 22359555
- PMCID: PMC3281030
- DOI: 10.1371/journal.pone.0030910
Genome-wide association study identified a narrow chromosome 1 region associated with chicken growth traits
Abstract
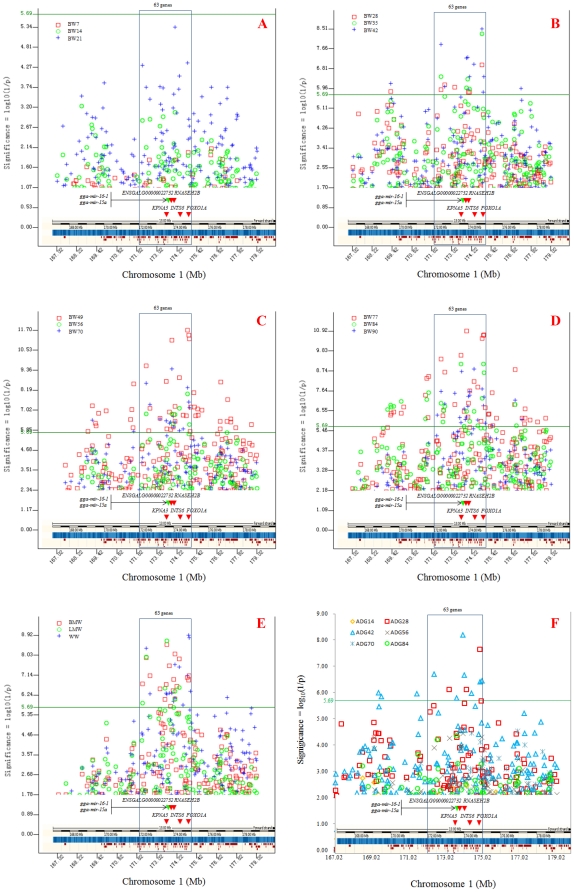
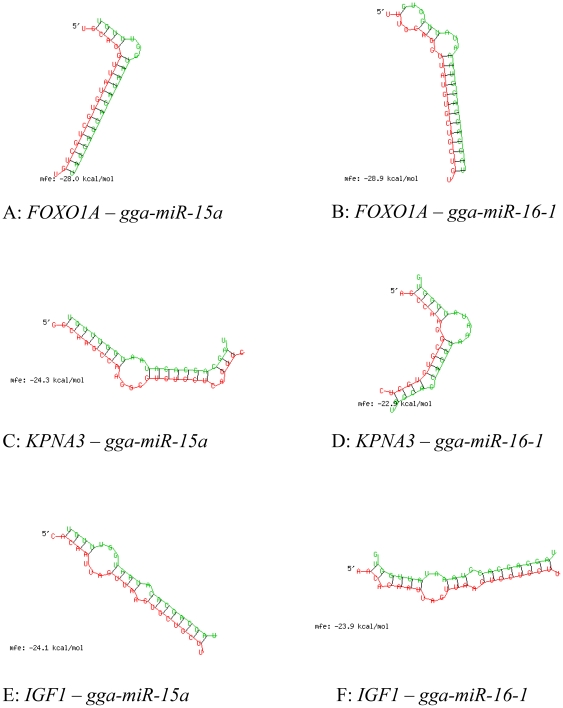
Chicken growth traits are important economic traits in broilers. A large number of studies are available on finding genetic factors affecting chicken growth. However, most of these studies identified chromosome regions containing putative quantitative trait loci and finding causal mutations is still a challenge. In this genome-wide association study (GWAS), we identified a narrow 1.5 Mb region (173.5-175 Mb) of chicken (Gallus gallus) chromosome (GGA) 1 to be strongly associated with chicken growth using 47,678 SNPs and 489 F2 chickens. The growth traits included aggregate body weight (BW) at 0-90 d of age measured weekly, biweekly average daily gains (ADG) derived from weekly body weight, and breast muscle weight (BMW), leg muscle weight (LMW) and wing weight (WW) at 90 d of age. Five SNPs in the 1.5 Mb KPNA3-FOXO1A region at GGA1 had the highest significant effects for all growth traits in this study, including a SNP at 8.9 Kb upstream of FOXO1A for BW at 22-48 d and 70 d, a SNP at 1.9 Kb downstream of FOXO1A for WW, a SNP at 20.9 Kb downstream of ENSGALG00000022732 for ADG at 29-42 d, a SNP in INTS6 for BW at 90 d, and a SNP in KPNA3 for BMW and LMW. The 1.5 Mb KPNA3-FOXO1A region contained two microRNA genes that could bind to messenger ribonucleic acid (mRNA) of IGF1, FOXO1A and KPNA3. It was further indicated that the 1.5 Mb GGA1 region had the strongest effects on chicken growth during 22-42 d.
Conflict of interest statement
Figures
References
-
- Liu X, Zhang H, Li H, Li N, Zhang Y, et al. Fine-mapping quantitative trait loci for body weight and abdominal fat traits: effects of marker density and sample size. Poult Sci. 2008;87:1314–1319. - PubMed
-
- Hu Z, Park C, Fritz E, Reecy J. QTLdb: a comprehensive database tool building bridges between genotypes and phenotypes. 2010. The 9th World Congress on Genetics Applied to Livestock Production. Leipzig, Germany August 1–6, 2010.
-
- Ankra-Badu GA, Le Bihan-Duval E, Mignon-Grasteau S, Pitel F, Beaumont C, et al. Mapping QTL for growth and shank traits in chickens divergently selected for high or low body weight. Anim Genet. 2010;41:400–405. - PubMed
-
- Sewalem A, Morrice DM, Law A, Windsor D, Haley CS, et al. Mapping of quantitative trait loci for body weight at three, six, and nine weeks of age in a broiler layer cross. Poult Sci. 2002;81:1775–1781. - PubMed
Publication types
MeSH terms
LinkOut - more resources
Full Text Sources
Medical
Research Materials
Miscellaneous
