. 2012;7(2):e31149.
doi: 10.1371/journal.pone.0031149. Epub 2012 Feb 16.

Genome-wide identification, evolutionary expansion, and expression profile of homeodomain-leucine zipper gene family in poplar (Populus trichocarpa)

Affiliations

Genome-wide identification, evolutionary expansion, and expression profile of homeodomain-leucine zipper gene family in poplar (Populus trichocarpa)

Ruibo Hu et al. PLoS One. 2012.

Abstract

Background: Homeodomain-leucine zipper (HD-ZIP) proteins are plant-specific transcriptional factors known to play crucial roles in plant development. Although sequence phylogeny analysis of Populus HD-ZIPs was carried out in a previous study, no systematic analysis incorporating genome organization, gene structure, and expression compendium has been conducted in model tree species Populus thus far.

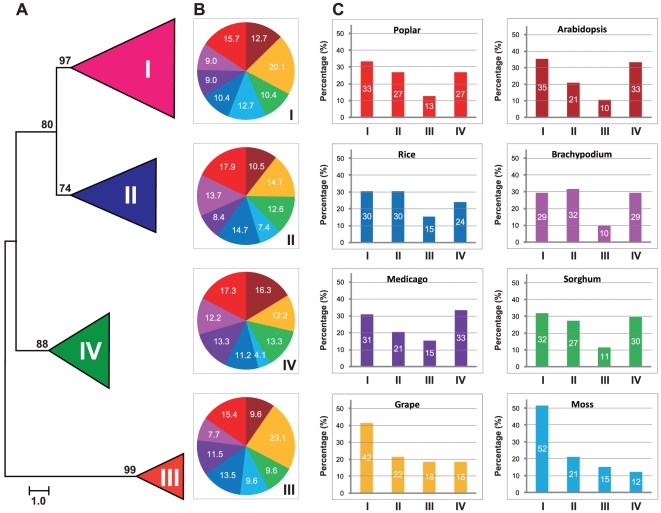
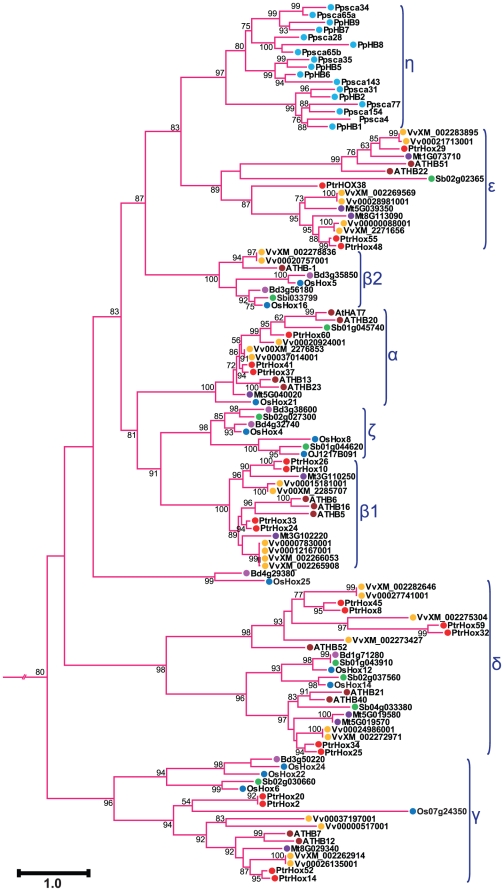
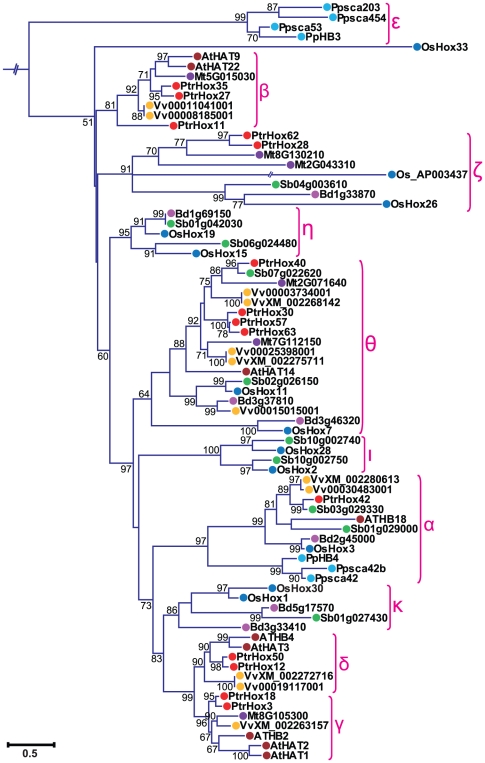
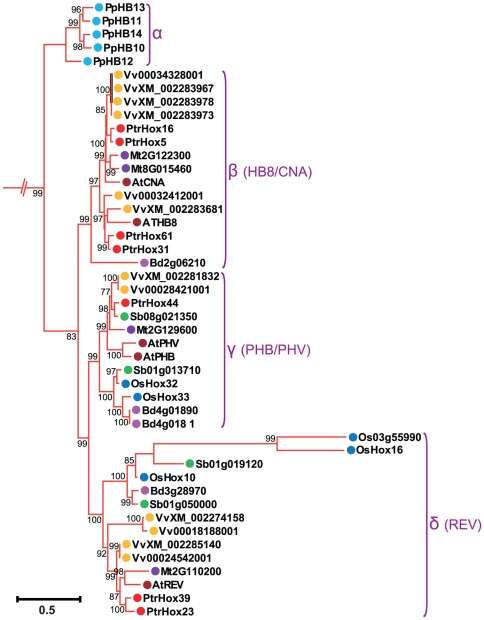
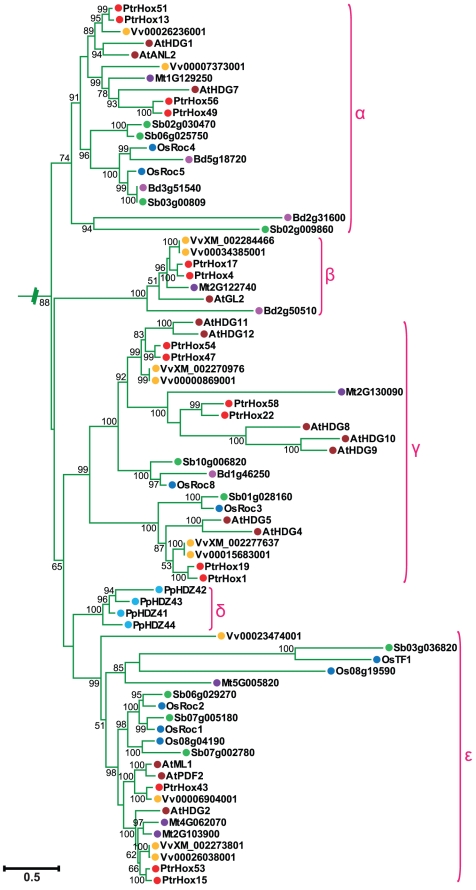
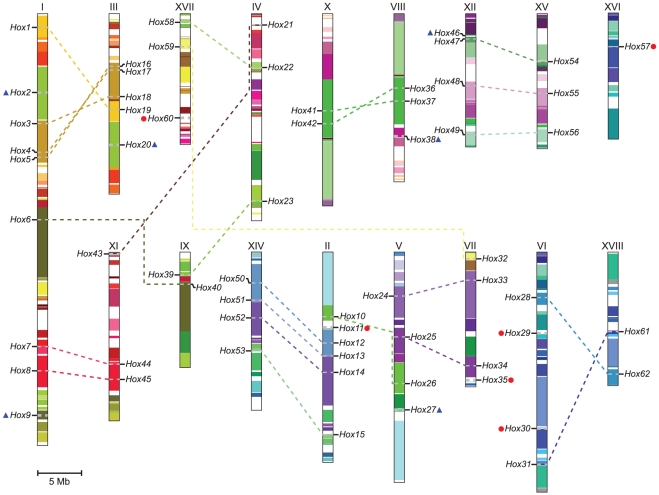
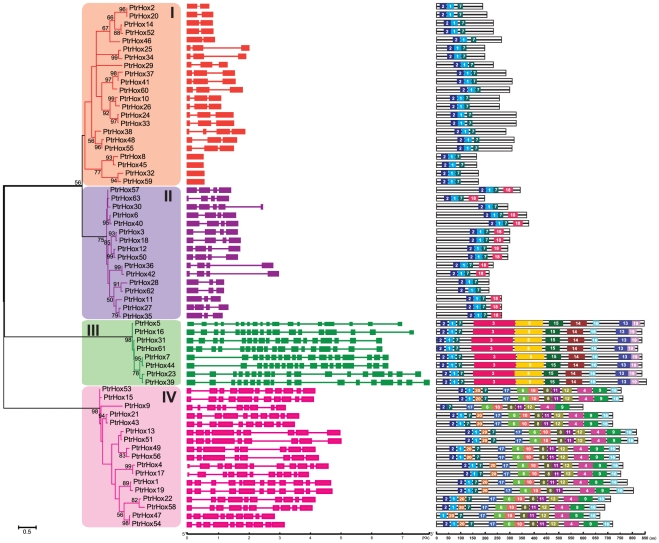
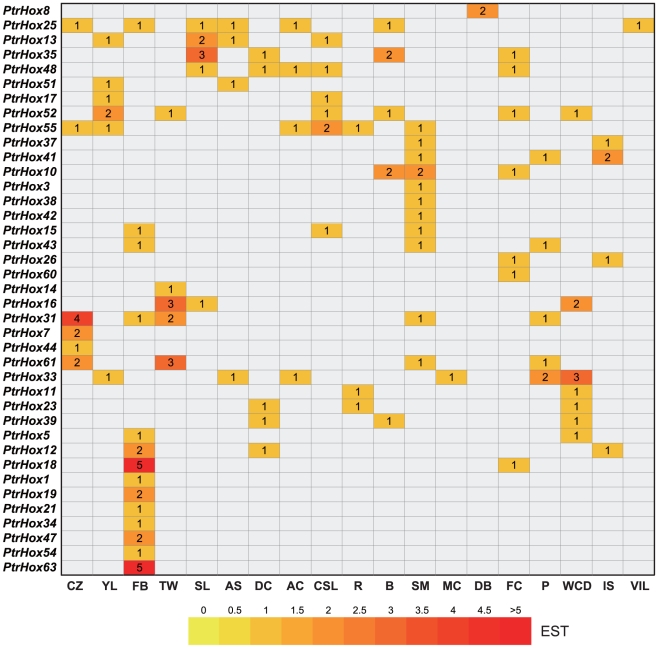
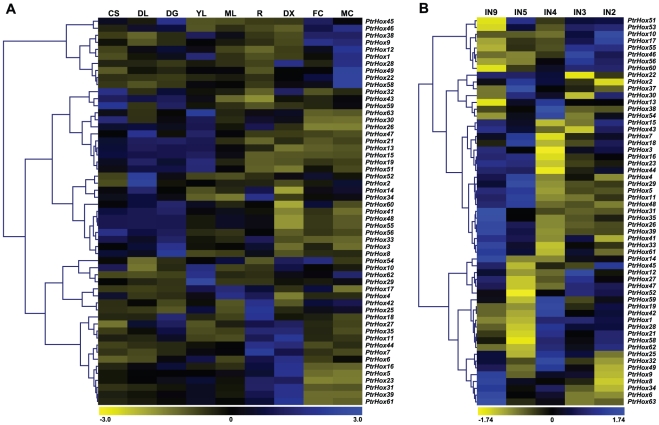
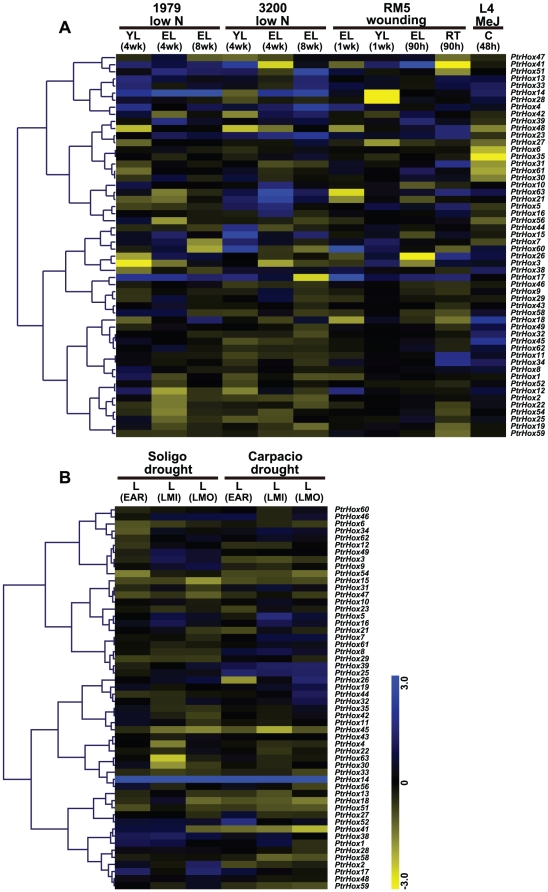
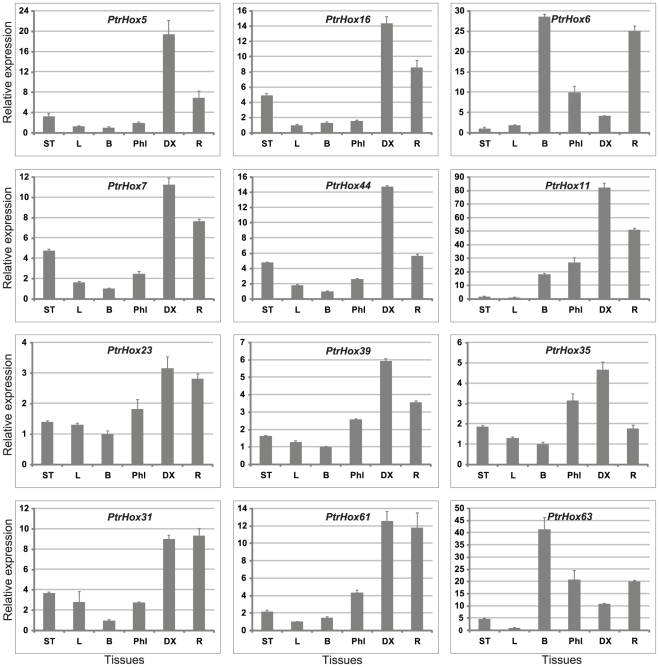
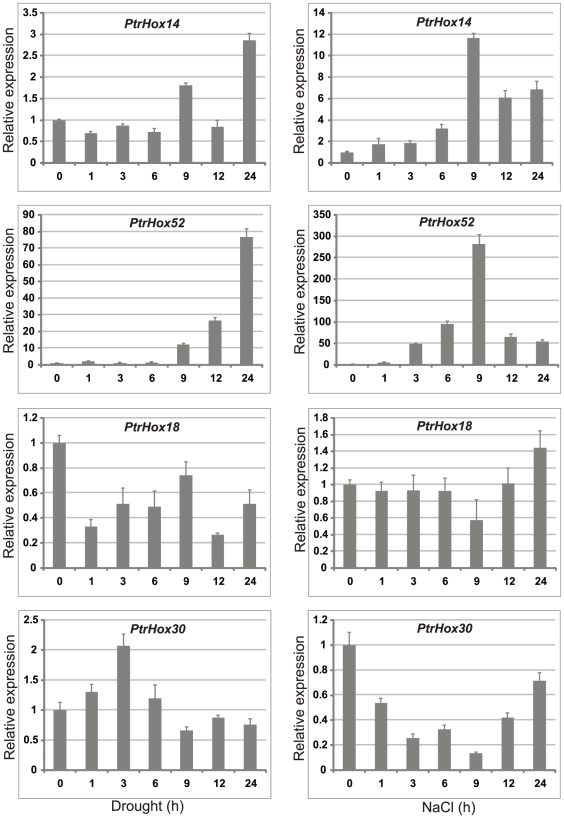
Principal findings: In this study, a comprehensive analysis of Populus HD-ZIP gene family was performed. Sixty-three full-length HD-ZIP genes were found in Populus genome. These Populus HD-ZIP genes were phylogenetically clustered into four distinct subfamilies (HD-ZIP I-IV) and predominately distributed across 17 linkage groups (LG). Fifty genes from 25 Populus paralogous pairs were located in the duplicated blocks of Populus genome and then preferentially retained during the sequential evolutionary courses. Genomic organization analyses indicated that purifying selection has played a pivotal role in the retention and maintenance of Populus HD-ZIP gene family. Microarray analysis has shown that 21 Populus paralogous pairs have been differentially expressed across different tissues and under various stresses, with five paralogous pairs showing nearly identical expression patterns, 13 paralogous pairs being partially redundant and three paralogous pairs diversifying significantly. Quantitative real-time RT-PCR (qRT-PCR) analysis performed on 16 selected Populus HD-ZIP genes in different tissues and under both drought and salinity stresses confirms their tissue-specific and stress-inducible expression patterns.

Conclusions: Genomic organizations indicated that segmental duplications contributed significantly to the expansion of Populus HD-ZIP gene family. Exon/intron organization and conserved motif composition of Populus HD-ZIPs are highly conservative in the same subfamily, suggesting the members in the same subfamilies may also have conservative functionalities. Microarray and qRT-PCR analyses showed that 89% (56 out of 63) of Populus HD-ZIPs were duplicate genes that might have been retained by substantial subfunctionalization. Taken together, these observations may lay the foundation for future functional analysis of Populus HD-ZIP genes to unravel their biological roles.


Conflict of interest statement

Competing Interests: The authors have declared that no competing interests exist.

Figures

Figure 1
Figure 1. Phylogeny and distribution of HD-ZIP protein from eight plant species.
A. Phylogenetic tree of HD-ZIP proteins from Arabidopsis, rice, Medicago, sorghum, Brachypodium, Populus, Vitis, and moss. Phylogeny was constructed by PhyML using maximum likelihood analysis. Bootstrap support values as percentage, are shown on selected major branches. The scale bar indicates the estimated number of amino acid substitutions per site. B. Percentage representation of HD-ZIP across the eight plant species within each subfamily. Colors correspond to the plant taxa as listed in C. C: Percentage representation of distributions for HD-ZIP within each plant species.
Figure 2
Figure 2. Phylogenetic relationship of HD-ZIP I subfamily from eight plant species.
Expanded view of the phylogeny of HD-ZIP I members from Figure 1A. Numbers at each branch indicate bootstrap values and only values higher than 50% are shown. Scale bar corresponds to the estimated number of amino acid substitutions per site. Filled circles represent HD-ZIP proteins from different plant species with colors corresponding to plant taxa as indicated in Figure 1.
Figure 3
Figure 3. Phylogenetic relationship of HD-ZIP II subfamily from eight plant species.
Expanded view of the phylogeny of HD-ZIP II members from Figure 1A. The numbers at the nodes represent the bootstrap values (>50%) from 100 replicates. Scale bar indicates the estimated number of amino acid substitutions per site. Filled circles represent HD-ZIP proteins from different plant species with colors corresponding to plant taxa as indicated in Figure 1.
Figure 4
Figure 4. Phylogenetic relationship of HD-ZIP III subfamily from eight plant species.
Enlarged view of the phylogeny of HD-ZIP III members from Figure 1A. Numbers at each branch indicate bootstrap values and only values higher than 50% are shown. Scale bar corresponds to the estimated number of amino acid substitutions per site. Filled circles represent HD-ZIP proteins from different plant species. Colors correspond to plant taxa as indicated in Figure 1.
Figure 5
Figure 5. Phylogenetic relationship of HD-ZIP IV subfamily from eight plant species.
Enlarged view of the phylogeny of HD-ZIP IV members from Figure 1A. The numbers at the nodes represent the bootstrap values (>50%) from 100 replicates. Scale bar indicates the estimated number of amino acid substitutions per site. Filled circles represent HD-ZIP proteins from different plant species. Colors correspond to plant taxa as indicated in Figure 1.
Figure 6
Figure 6. Chromosomal locations and segmental duplication events of Populus HD-ZIP genes.
The schematic diagram of genome-wide chromosome organization arisen from the salicoid genome duplication event in Populus was accomplished based on duplication coordinates from the Populus genome assembly v2.1. Segmental duplicated blocks are indicated with the same colors. The duplicated paralogous pairs of HD-ZIP are connected with dotted lines. Blue triangles indicate HD-ZIPs located on duplicated segments with the corresponding member lost. Red circles represent HD-ZIPs located out of any duplicated regions. Scale represents a 5 Mb chromosomal distance.
Figure 7
Figure 7. Phylogenetic relationship, gene structure and motif compositions of Populus HD-ZIP genes.
A. The phylogenetic tree was constructed using full-length protein sequences by the maximum likelihood method with 100 bootstrap replicates. The percentage bootstrap scores higher than 50% are indicated on the nodes. The four major phylogenetic subfamilies designated as I to IV are marked with different color backgrounds. B. Exon/intron structures of HD-ZIP genes from Populus. Exons and introns are represented by green boxes and black lines, respectively. The sizes of exons and introns are proportional to their sequence lengths. C. Schematic representation of the conserved motifs in the HD-ZIP proteins from Populus elucidated by MEME. Each motif is represented by a number in the colored box. The details of individual motif are provided in Table S4.
Figure 8
Figure 8. In sillico EST analysis of Populus HD-ZIP genes.
EST frequency for each gene was calculated by evaluating its EST representation among 19 cDNA libraries available at PopGenIE (http://www.popgenie.org/) . The heatmap was visualized using Heatmapper Plus tool by counting the corresponding ESTs for particular gene in the database. Color bar at bottom represents the frequencies of EST counts. CZ: cambial zone, YL: young leaves, FB: flower buds, TW: tension wood, SL: senescing leaves, AS: apical shoot, DC: dormant cambium, AC: active cambium, CSL: cold stressed leaves, R: roots, B: bark, SM: shoot meristem, MC: male catkins, DB: dormant buds, FC: female catkins, P: petioles, WCD: wood cell death, IS: imbibed seeds, VIS: Virus/fungus-infected leaves.
Figure 9
Figure 9. Expression profiles of Populus HD-ZIP genes across different tissues.
Background corrected expression intensities were log-transformed and visualized as heatmaps (see Materials and Methods). A. Heatmap showing hierarchical clustering of 54 PtrHox genes across various tissues analyzed. The Affymetrix microarray data were obtained from NCBI Gene Expression Omnibus (GEO) database under the series accession number GSE13990. CL, continuous light-grown seedling; DL, etiolated dark-grown seedling transferred to light for 3 h; DS, dark-grown seedlings; YL, young leaf; ML, mature leaf; R, root; DX, differentiating xylem; FC, female catkins; MC, male catkins. B. Heatmap showing hierarchical clustering of 57 PtrHox genes at different stem development/growth stages. The NimbleGen microarray data were obtained from NCBI GEO database under the series accession number GSE17230. IN2-IN9, stem internodes 2 to stem internodes 9. Color scale represents log2 expression values, yellow represents low level and blue indicates high level of transcript abundances.
Figure 10
Figure 10. Differential expression of Populus HD-ZIP genes under different abiotic stresses.
Expression is indicated as fold-change of experimental treatments relative to control samples and visualized in heatmaps (see Materials and Methods). Color scale represents log2 expression values, yellow represents low level and blue indicates high level of transcript abundances. A. Heatmap showing hierarchical clustering of 54 PtrHox genes across various tissues and genotypes analyzed. Microarray data under the series accession number GSE16786 was obtained from NCBI GEO database. Genotypes analyzed included: P. fremontii×angustifolia clones 1979, 3200, and RM5, P. tremuloides clones 271 and L4, and Populus deltoids clones Soligo and Carpaccio. Tissues analyzed included: YL, young leaves; EL, expanding leaves; ML, mature leaves; RT, root tips; C, suspension cell cultures. Stress treatments included: low N, nitrogen limitation; MeJ, Methyl Jasmonate elicitation; wounding, sampled either one week or 90 hours after wounding. B. Heatmap showing hierarchical clustering of 54 PtrHox genes under short-term and long-term water deficit. Microarray data under the series accession number GSE17230 was obtained from NCBI GEO database. EAR, early response (EAR) to water deficit by 36 hours; LMI, long-term (10-day) response to mild stress with soil relative extractable water (REW) at 20–35%; LMO, long-term (10-day) response to moderate stress with soil relative extractable water (REW) at 10–20%.
Figure 11
Figure 11. Expression analysis of 12 selected HD-ZIP genes using qRT-PCR.
The relative mRNA abundance of 12 selected HD-ZIP genes was normalized with respect to two reference genes UBQ10 and UKN1 (Populus orthologue of Arabidopsis AT4G33380) in six different tissues. Bars represent standard deviations (SD) of three technical replicates. ST, shoot tips; L, leaves from 4–6 stem internodes; Phl, phloem; DX, differentiating xylem; R, roots; B, bark.
Figure 12
Figure 12. Expression analysis of four selected HD-ZIP genes under drought and salinity stresses using qRT-PCR.
The relative mRNA abundance of four selected HD-ZIP genes was normalized with respect to two reference genes UBQ10 and PP2a in drought and salinity stress treatments. Bars represent standard deviations (SD) of three technical replicates. X-axis is time courses of stress treatments for each gene.

Similar articles

Cited by

References

    1. Gehring WJ, Qian YQ, Billeter M, Furukubo-Tokunaga K, Schier AF, et al. Homeodomain-DNA recognition. Cell. 1994;78:211–223. - PubMed
    1. Mukherjee K, Brocchieri L, Burglin TR. A comprehensive classification and evolutionary analysis of plant homeobox genes. Mol Biol Evol. 2009;26:2775–2794. - PMC - PubMed
    1. Ruberti I, Sessa G, Lucchetti S, Morelli G. A novel class of plant proteins containing a homeodomain with a closely linked leucine zipper motif. EMBO J. 1991;10:1787–1791. - PMC - PubMed
    1. Sessa G, Morelli G, Ruberti I. The Athb-1 and -2 HD-Zip domains homodimerize forming complexes of different DNA binding specificities. EMBO J. 1993;12:3507–3517. - PMC - PubMed
    1. Frank W, Phillips J, Salamini F, Bartels D. Two dehydration-inducible transcripts from the resurrection plant Craterostigma plantagineum encode interacting homeodomain-leucine zipper proteins. Plant J. 1998;15:413–421. - PubMed

Publication types