

HIV-1 subtype D infections among Caucasians from Northwestern Poland--phylogenetic and clinical analysis
- PMID: 22359615
- PMCID: PMC3280981
- DOI: 10.1371/journal.pone.0031674
HIV-1 subtype D infections among Caucasians from Northwestern Poland--phylogenetic and clinical analysis
Abstract
Background: HIV-1 subtype D infections, which are associated with a faster rate of progression and lymphocyte CD4 decline, cognitive deficit and higher mortality, have rarely been found in native Europeans. In Northwestern Poland, however, infections with this subtype had been identified. This study aimed to analyze the sequence and clinical data for patients with subtype D using molecular phylogeography and identify transmission clusters and ancestry, as well as drug resistance, baseline HIV tropism and antiretroviral treatment efficacy.
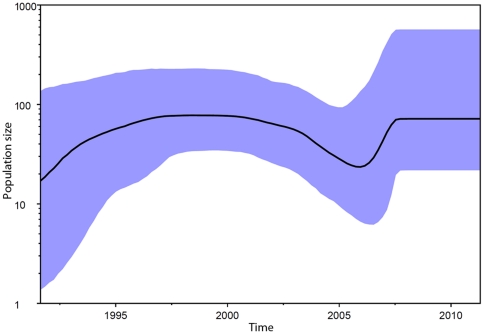
Methods: Phylogenetic analyses of local HIV-1 subtype D sequences were performed, with time to the most recent common ancestor inferred using bayesian modeling. Sequence and drug resistance data were linked with the clinical and epidemiological information.
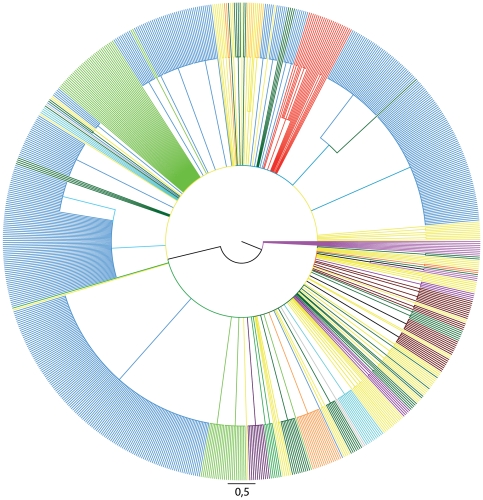
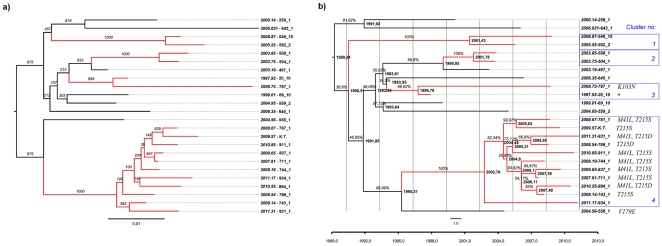
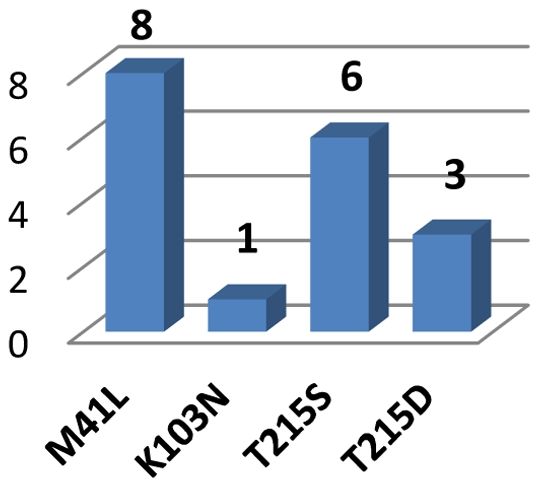
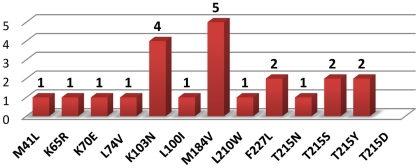
Results: Subtype D was found in 24 non-immigrant Caucasian, heterosexually infected patients (75% of females, median age at diagnosis of 49.5 years; IQR: 29-56 years). Partial pol sequences clustered monophyletically with the clades of Ugandan origin and no evidence of transmission from other European countries was found. Time to the most common recent ancestor was 1989.24 (95% HPD: 1968.83-1994.46). Baseline drug resistance to nucleoside reverse transcriptase inhibitors was observed in 54.5% of cases (mutations: M41L, K103N, T215S/D) with evidence of clustering, no baseline integrase or protease resistance and infrequent non-R5 tropism (13.6%). Virologic failure was observed in 60% of cases and was associated with poor adherence (p<0.001) and subsequent development of drug resistance (p = 0.008, OR: 20 (95%CI: 1.7-290).
Conclusions: Local subtype D represented an independently transmitted network with probably single index case, high frequency of primary drug resistance and evidence of transmission clusters.
Conflict of interest statement
Figures
References
-
- Paraskevis D, Magiorkinis E, Magiorkinis G, Sypsa V, Paparizos V, et al. Increasing prevalence of HIV-1 subtype A in Greece: estimating epidemic history and origin. The Journal of infectious diseases. 2007;196:1167–1176. - PubMed
-
- Geretti AM. HIV-1 subtypes: epidemiology and significance for HIV management. Current opinion in infectious diseases. 2006;19:1–7. - PubMed
Publication types
MeSH terms
Substances
Associated data
- Actions
- Actions
- Actions
- Actions
- Actions
- Actions
- Actions
- Actions
- Actions
- Actions
- Actions
- Actions
- Actions
- Actions
- Actions
- Actions
- Actions
- Actions
- Actions
- Actions
- Actions
- Actions
- Actions
- Actions
- Actions
- Actions
- Actions
- Actions
- Actions
- Actions
- Actions
- Actions
- Actions
- Actions
- Actions
- Actions
- Actions
- Actions
- Actions
- Actions
- Actions
- Actions
- Actions
- Actions
- Actions
- Actions
- Actions
- Actions
- Actions
LinkOut - more resources
Full Text Sources
Medical
Research Materials
