. 2012;7(2):e31711.
doi: 10.1371/journal.pone.0031711. Epub 2012 Feb 16.

Collective motion of cells mediates segregation and pattern formation in co-cultures

Affiliations

Collective motion of cells mediates segregation and pattern formation in co-cultures

Elod Méhes et al. PLoS One. 2012.

Abstract

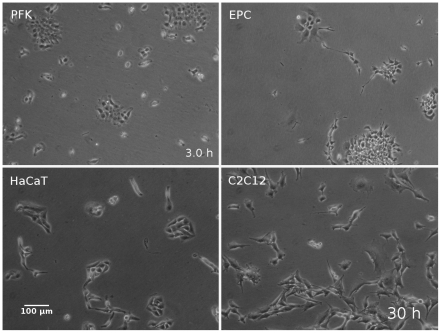
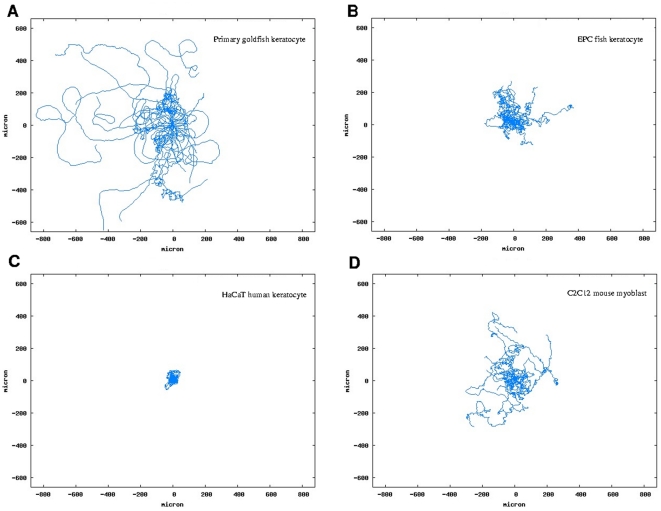
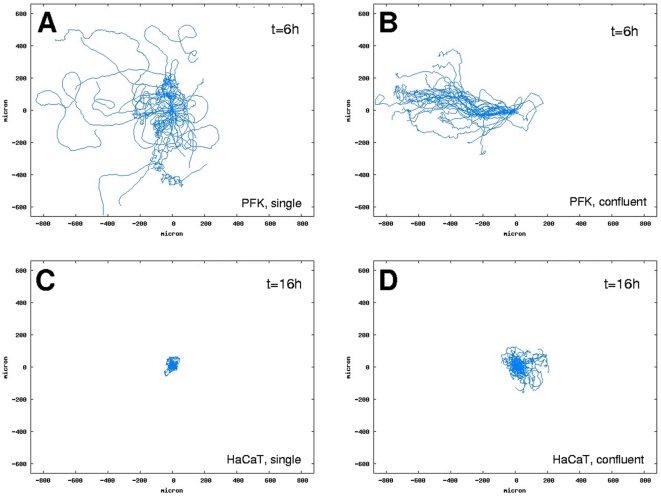
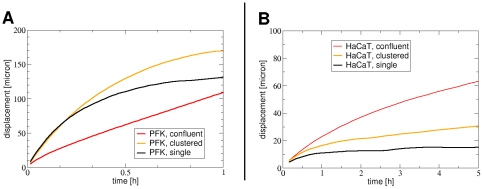
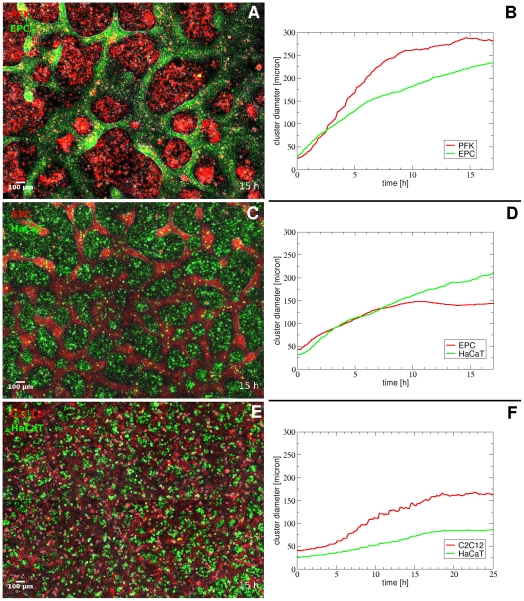
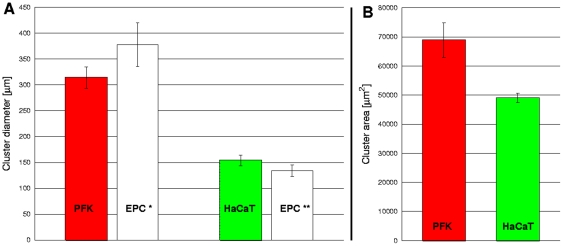
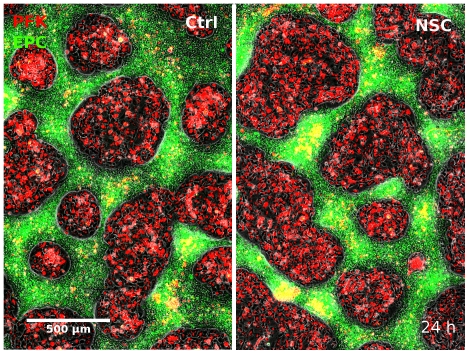
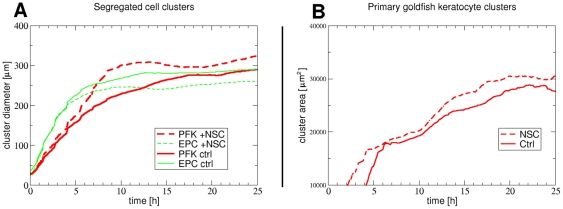
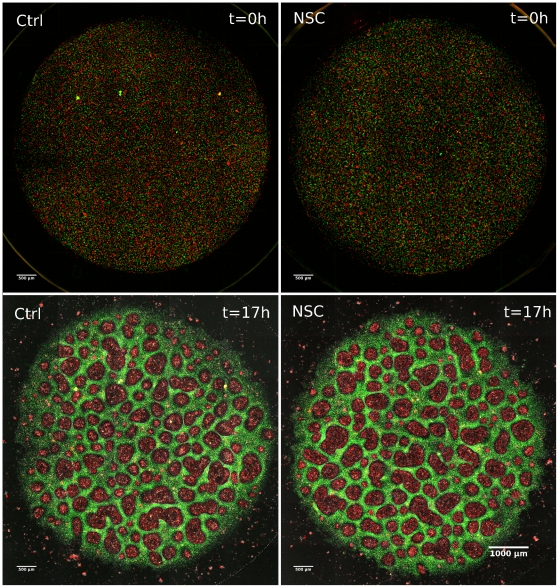
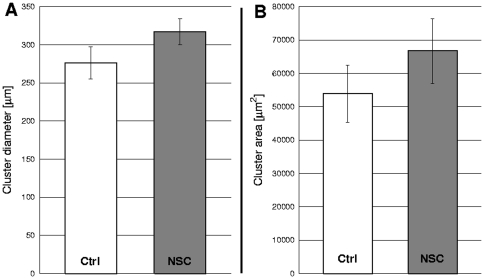
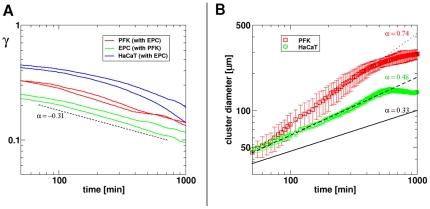
Pattern formation by segregation of cell types is an important process during embryonic development. We show that an experimentally yet unexplored mechanism based on collective motility of segregating cells enhances the effects of known pattern formation mechanisms such as differential adhesion, mechanochemical interactions or cell migration directed by morphogens. To study in vitro cell segregation we use time-lapse videomicroscopy and quantitative analysis of the main features of the motion of individual cells or groups. Our observations have been extensive, typically involving the investigation of the development of patterns containing up to 200,000 cells. By either comparing keratocyte types with different collective motility characteristics or increasing cells' directional persistence by the inhibition of Rac1 GTP-ase we demonstrate that enhanced collective cell motility results in faster cell segregation leading to the formation of more extensive patterns. The growth of the characteristic scale of patterns generally follows an algebraic scaling law with exponent values up to 0.74 in the presence of collective motion, compared to significantly smaller exponents in case of diffusive motion.


Conflict of interest statement

Competing Interests: The authors have declared that no competing interests exist.

Figures

Figure 1
Figure 1. Morphology and patterns of the cell types studied.
Phase contrast images of the cell types studied: primary goldfish keratocytes (PFK), fish keratocyte cell line (EPC), human keratocyte cell line (HaCaT) and mouse myoblast cell line (C2C12). See also Video S1.
Figure 2
Figure 2. Typical trajectories of the cell types studied.
Superposed trajectories of 20 randomly selected single cells from each cell type studied: primary goldfish keratocytes (A), EPC fish keratocytes (B), HaCaT human keratocytes (C) and C2C12 mouse myoblasts (D). Trajectories from 50 hours of observation are shown for all panels except for panel A where 6 hours were observed for similar trajectory lengths due to high velocity of primary goldfish keratocytes. Trajectories are superposed to start from the same origin for better comparison. Note the differences in the curves of typical cell trajectories indicating differences in directional persistence.
Figure 3
Figure 3. Comparison of trajectories at different cell densities.
Superposed trajectories of primary goldfish keratocytes (PFK) (A and B) and HaCaT keratocytes (C and D) migrating either as single cells or in clusters for durations t = 6 h (A and B) or t = 16 h (C and D). Trajectories of 30 randomly selected cells are shown in each panel. Note the increase in linear trajectories in panels B and D compared to panels A and C.
Figure 4
Figure 4. Comparison of cell motility at various cell densities.
Empirical distance(t) curves for primary goldfish keratocytes (PFK) (A) and HaCaT keratocytes (B) at different cell densities. Data are from trajectories of cells migrating as singles or in clusters or in confluent monolayer. Note the increase in the linear segment of the red curves, corresponding to highest cell densities, compared to other curves.
Figure 5
Figure 5. Comparison of co-culture cell clusters and cluster formation dynamics.
Left: merged fluorescent and phase contrast images of representative segregating co-cultures of primary goldfish keratocytes (PFK) + EPC keratocytes (A) or EPC keratocytes + HaCaT keratocytes (C) or C2C12 myoblasts + HaCaT keratocytes (E) taken when cluster sizes have reached maximum. Right: temporal changes in segregated cell cluster sizes calculated by two-point correlation method. Note the considerable differences in cluster sizes between panels A and C. See also Video S5, S6 and S7 of the same fields (A, C and E).
Figure 6
Figure 6. Comparison of cell cluster formation data: diameter and area.
Final segregated cell cluster diameters (A) and cluster areas (B) in primary goldfish keratocyte (PFK) + EPC co-cultures (n = 7) or HaCaT + EPC co-cultures (n = 3). Error bars represent SEM. Note the difference between PFK and HaCaT cluster diameters and areas and also the difference between the diameters of EPC clusters in the two co-culture settings (EPC* and EPC**).
Figure 7
Figure 7. Comparison of cell cluster formation without/with Rac1 inhibition.
Comparison of fields of views showing developing clusters in mixed co-cultures of primary goldfish keratocytes (PFK, red) and EPC fish keratocytes (green) 24 hours after seeding. Untreated culture (A) is compared with the culture treated with 30 uM Rac1 inhibitor NSC-23766 (B). Note the larger red PFK clusters in B. See also Video S8.
Figure 8
Figure 8. Cell cluster formation dynamics without/with of Rac1 inhibition.
Temporal changes in segregated cell cluster diameters measured as two-point correlation lengths (A) and cluster areas (B) for primary goldfish keratocytes (red) and EPC keratocytes (green) in representative fields of views in confluent mixed co-cultures not treated (solid lines) or treated with Rac1 inhibitor NSC-23766 (30 µM) from the beginning (dashed lines). Note the formation of larger primary goldfish keratocyte clusters (dashed red line in A and B) as a result of Rac1 inhibition. See also Video S8.
Figure 9
Figure 9. Comparison of cell cluster formation in whole co-cultures without/with Rac1 inhibition.
Cluster formation in mixed co-cultures of primary goldfish keratocytes (red) and EPC fish keratocytes (green). Upper panels are initial images of mixed cultures just after cell attachment where equal areas are covered by each cell type (panels A and B). Lower panels show final stage of cluster formation in untreated mixed culture (panel C) and the culture treated with Rac1 inhibitor NSC-23766 (30 µM) from the beginning (panel D). Note the larger cluster sizes of primary goldfish keratocytes (red) in panel C compared to panel D.
Figure 10
Figure 10. Cell cluster formation data without/with Rac1 inhibition.
Comparison of final cluster sizes of primary goldfish keratocytes (PFK) in mixed PFK+EPC co-cultures either untreated (white bars) or treated with Rac1 inhibitor NSC-23766 (30 µM) (grey bars). Cluster diameters, measured as two-point correlation lengths, (panel A) and cluster areas, counted in pixels, (panel B) are compared. Error bars represent SEM, p = 0.03562 for A and p = 0.01238 for B, n = 4 independent experiments.
Figure 11
Figure 11. Evolution of the segregation index (γ) and cluster size during cell segregation.
Panel A: Segregation index curves of the studied cell types are compared. The value of the segregation index γ indicates the average ratio of other type/all neighbor cells around a given cell calculated for consecutive time points. Note the approximately linear decay of γ on log-log scale beyond 100 minutes in several curves, indicating algebraic scaling. Lines correspond to independent experiments. The slope of the reference dashed line is −0.31. Panel B: Average cluster diameter growth curves calculated from independent experiments with primary fish keratocytes (n = 5) or HaCaT keratocytes (n = 3) are compared. Error bars are standard deviations. The exponent values obtained from fitting straight line segments to the average experimental curves are: 0.74 and 0.48 for PFK and HaCaT, respectively, shown in corresponding colors. Cluster growth curve of simulated segregation of cells without collective motion characterized by exponent value 0.33 is shown for reference (black solid line).

References

    1. Turing AM. The chemical basis of morphogenesis, Phil. Trans R Soc (Lond.) 1952;B237:37–72.
    1. Murray JD. On the mechanochemical theory of biological pattern formation with application to vasculogenesis. C R Biol. 2003;326:239–252. - PubMed
    1. Steinberg MS. Reconstruction of tissues by dissociated cells. Some morphogenetic tissue movements and the sorting out of embryonic cells may have a common explanation. Science. 1963;141:401–408. - PubMed
    1. Steinberg MS. Differential adhesion in morphogenesis: a modern view. Curr Opin Genet. 2007;Dev17:281–286. - PubMed
    1. Foty RA, Pfleger CM, Forgacs G, Steinberg MS. Surface tensions of embryonic tissues predict their mutual envelopment behavior. Development. 1996;122:1611–1620. - PubMed

Publication types