. 2012;7(2):e31791.
doi: 10.1371/journal.pone.0031791. Epub 2012 Feb 16.

Deciphering the preference and predicting the viability of circular permutations in proteins

Affiliations

Deciphering the preference and predicting the viability of circular permutations in proteins

Wei-Cheng Lo et al. PLoS One. 2012.

Abstract

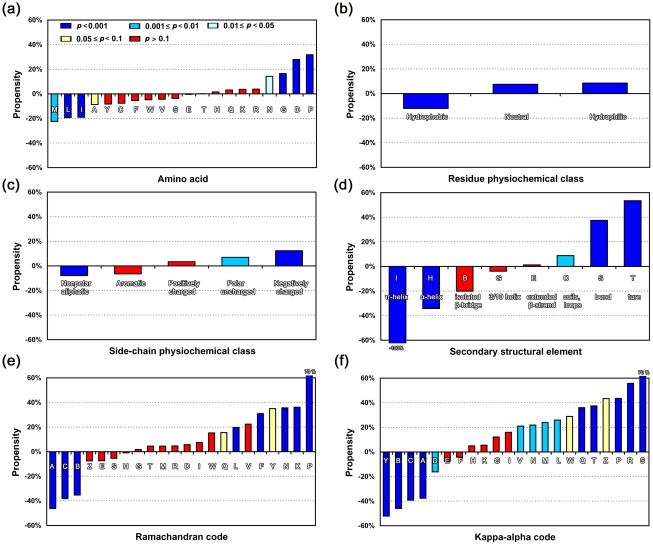
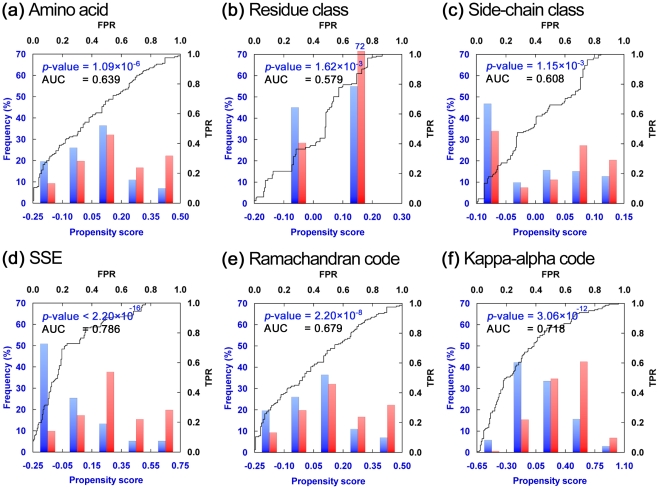
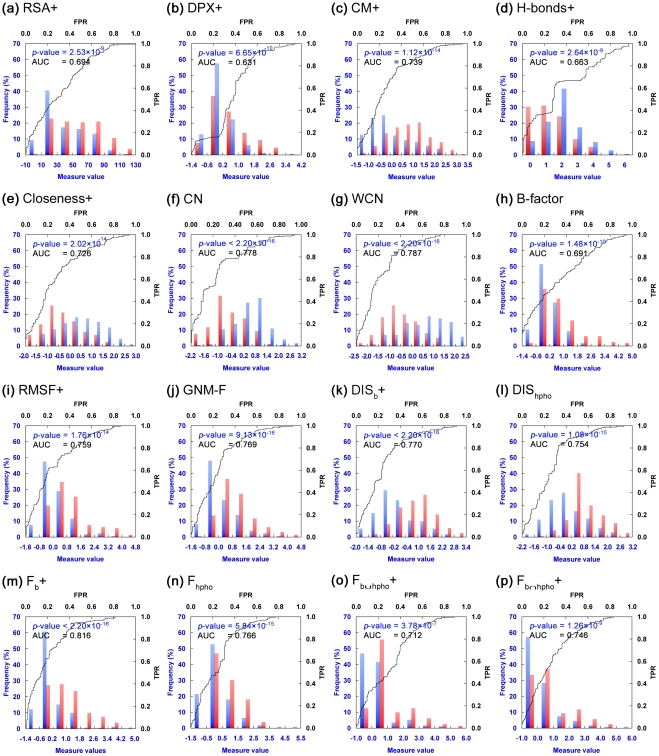
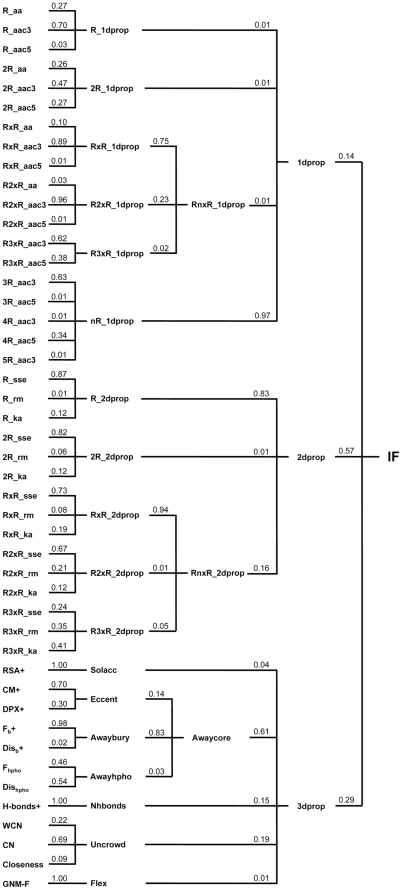
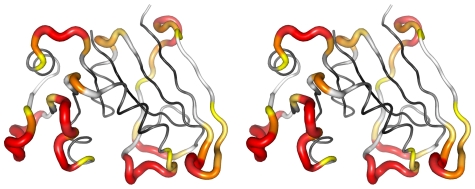
Circular permutation (CP) refers to situations in which the termini of a protein are relocated to other positions in the structure. CP occurs naturally and has been artificially created to study protein function, stability and folding. Recently CP is increasingly applied to engineer enzyme structure and function, and to create bifunctional fusion proteins unachievable by tandem fusion. CP is a complicated and expensive technique. An intrinsic difficulty in its application lies in the fact that not every position in a protein is amenable for creating a viable permutant. To examine the preferences of CP and develop CP viability prediction methods, we carried out comprehensive analyses of the sequence, structural, and dynamical properties of known CP sites using a variety of statistics and simulation methods, such as the bootstrap aggregating, permutation test and molecular dynamics simulations. CP particularly favors Gly, Pro, Asp and Asn. Positions preferred by CP lie within coils, loops, turns, and at residues that are exposed to solvent, weakly hydrogen-bonded, environmentally unpacked, or flexible. Disfavored positions include Cys, bulky hydrophobic residues, and residues located within helices or near the protein's core. These results fostered the development of an effective viable CP site prediction system, which combined four machine learning methods, e.g., artificial neural networks, the support vector machine, a random forest, and a hierarchical feature integration procedure developed in this work. As assessed by using the hydrofolate reductase dataset as the independent evaluation dataset, this prediction system achieved an AUC of 0.9. Large-scale predictions have been performed for nine thousand representative protein structures; several new potential applications of CP were thus identified. Many unreported preferences of CP are revealed in this study. The developed system is the best CP viability prediction method currently available. This work will facilitate the application of CP in research and biotechnology.


Conflict of interest statement

Competing Interests: The authors have declared that no competing interests exist.

Figures

Figure 1
Figure 1. Sequence and Secondary Structural Propensities of Viable CP Sites.
In these charts, each bar shows the relative occurrence of a pattern, e.g., an amino acid, a physiochemical type of residue, or an SSE, for the background polypeptides (in dataset nrCPDB-40) and viable CP sites (in dataset nrCPsitecpdb-40). The background value was considered as the zero point in each experiment; thus, a positive or a negative value means that the frequency of the pattern at CP sites was higher or lower than its frequency in the background. As shown in chart (a), dark blue- to light blue-colored bars represent smaller p-values (<0.05) for the difference between the background and CP site groups. The yellow- and red-colored bars represent p-values≥0.05. Patterns examined in this experiment include: (a) amino acids, (b) residue physiochemical types classified according to , (c) side-chain physiochemical types classified according to , (d) SSE determined by DSSP , (e) Ramachandran code, the backbone conformational alphabet defined by SARST , and (f) kappa-alpha code, the backbone conformational alphabet defined by 3D-BLAST .
Figure 2
Figure 2. Distributions and ROC Curves of Propensity Scores.
Here, a propensity score was calculated as the relative propensity of a pattern between the background and viable CP sites weighted by 1 – p-value (see Formula 1). A high relative propensity and a small p-value resulted in a high score. A zero score means that there was no obvious difference between the frequencies of the pattern in the background and viable CP sites, or the difference was statistically insignificant. These plots show distributions of several propensity scores for the viable (red bars) and inviable (blue bars) CP sites of Dataset L and their ROC curves. Plots (a)–(c) and (d)–(f) respectively exhibit the results of sequence-based and secondary structure-based propensity scores. The distributions of the sequence-based propensity scores are not very different between the viable and inviable CP sites, and their AUCs are only ∼0.6. The distributions of secondary structure-based propensity scores were rather different between viable and inviable CP sites, and thus the AUCs were higher than those of sequence-based scores. The lower x axis in each plot indicates the propensity score. The left y axis indicates the frequency, i.e., the proportion of residues falling into each score group. The upper x axis and right y axis represent the false positive rate and true positive rate, respectively, for the ROC curve.
Figure 3
Figure 3. Distribution and ROC Curves of Various Tertiary Structure-derived Residue Measures.
In general, the differences in the distributions of tertiary structure-derived residue measures in viable (red bars) and inviable (blue bars) CP sites of Dataset L were larger and statistically more significant than those of the sequence and secondary structural propensity scores. Their AUC values were also larger in most cases. See Figure 2 for descriptions of the four axes. The abbreviations shown on top of each plot stand for: (a) relative solvent accessibility, (b) residue depth, (c) centroid distance measure, (d) number of hydrogen bonds, (e) closeness, (f) contact number, (g) weighted contact number, (h) atomic mean-square displacement, (i) root-mean-square fluctuation of the Cα atom, (j) Gaussian network model-derived mean-square fluctuation, (k) average distance to the residues located in the buried core, (l) average distance to hydrophobic residues, (m) “farness” (see the main text for definition) from the buried core, (n) farness from hydrophobic residues, (o) farness from the union set of residues in the buried core and hydrophobic residues, and (p) farness from the hydrophobic residues located in the buried core. A plus (+) after an abbreviation for certain measures indicates that hydrogen atoms were restored/added before those measures were calculated. If the definition or algorithm of a measure did not consider hydrogen atoms, or if it made no difference to the results whether hydrogen atoms were present, that measure was computed without adding hydrogen atoms.
Figure 4
Figure 4. Classification Tree of the 46 Selected Features.
These features were selected based on their discriminatory performance for viable and inviable CPs in Dataset T. Redundant features (correlation coefficient >0.7) were screened out. The classification was done manually according to the similarities of biological meaning of these features. The purpose of this classification was to perform the hierarchical feature integration procedure developed in this work. The number following each feature abbreviation was the weight of that feature used in the hierarchical integration procedure. These weights were determined with the training Dataset T by exhaustive performance screening ( Materials and Methods ). Table S2 lists the complete meanings of the features abbreviated here.
Figure 5
Figure 5. Probability Scores of DHFR.
The structure of the dihydrofolate reductase from Escherichia coli (PDB entry: 1RX4) is shown as a cross-eye stereo image, in which the thickness of backbone of a residue is in proportion to the probability score computed by our prediction system for that residue. In addition, probability scores are color-coded — a color closer to red represents a higher score. Gray- to black-colored residues have scores increasingly lower than 0.5. Among the 67 residues with probability scores ≥0.5, only 6 are inviable CP sites (shown in blue). The other 61 residues are experimentally-verified viable CP sites . Thus, at a probability score threshold of 0.5, the precision of the developed prediction system for this independent evaluation dataset is 90% (61/67).

Similar articles

Cited by

References

    1. Cunningham BA, Hemperly JJ, Hopp TP, Edelman GM. Favin versus concanavalin A: Circularly permuted amino acid sequences. Proc Natl Acad Sci U S A. 1979;76:3218–3222. - PMC - PubMed
    1. Carrington DM, Auffret A, Hanke DE. Polypeptide ligation occurs during post-translational modification of concanavalin A. Nature. 1985;313:64–67. - PubMed
    1. Ponting CP, Russell RB. Swaposins: circular permutations within genes encoding saposin homologues. Trends Biochem Sci. 1995;20:179–180. - PubMed
    1. Lindqvist Y, Schneider G. Circular permutations of natural protein sequences: structural evidence. Curr Opin Struct Biol. 1997;7:422–427. - PubMed
    1. Uliel S, Fliess A, Unger R. Naturally occurring circular permutations in proteins. Protein Eng. 2001;14:533–542. - PubMed

Publication types