

Treatment- and population-dependent activity patterns of behavioral and expression QTLs
- PMID: 22359631
- PMCID: PMC3281015
- DOI: 10.1371/journal.pone.0031805
Treatment- and population-dependent activity patterns of behavioral and expression QTLs
Abstract
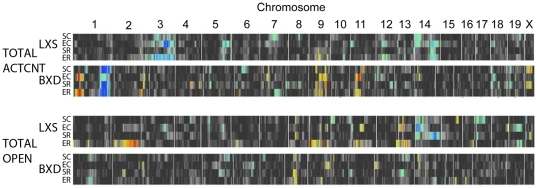
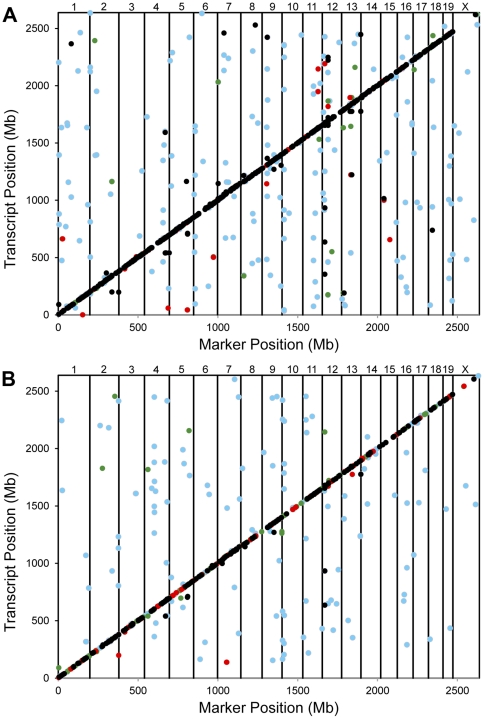
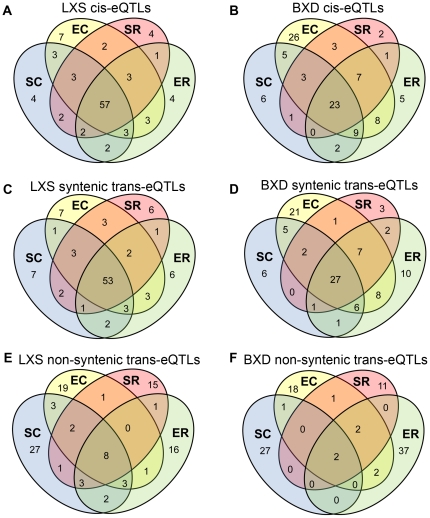
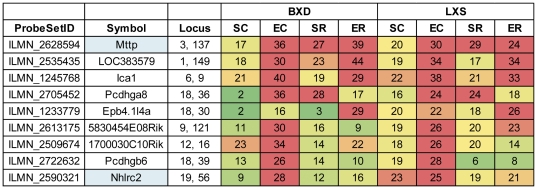
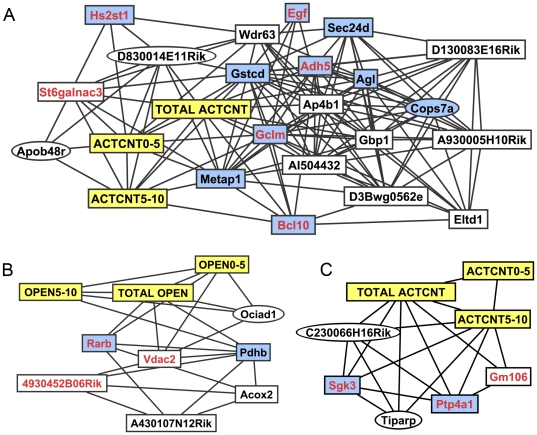
Genetic control of gene expression and higher-order phenotypes is almost invariably dependent on environment and experimental conditions. We use two families of recombinant inbred strains of mice (LXS and BXD) to study treatment- and genotype-dependent control of hippocampal gene expression and behavioral phenotypes. We analyzed responses to all combinations of two experimental perturbations, ethanol and restraint stress, in both families, allowing for comparisons across 8 combinations of treatment and population. We introduce the concept of QTL activity patterns to characterize how associations between genomic loci and traits vary across treatments. We identified several significant behavioral QTLs and many expression QTLs (eQTLs). The behavioral QTLs are highly dependent on treatment and population. We classified eQTLs into three groups: cis-eQTLs (expression variation that maps to within 5 Mb of the cognate gene), syntenic trans-eQTLs (the gene and the QTL are on the same chromosome but not within 5 Mb), and non-syntenic trans-eQTLs (the gene and the QTL are on different chromosomes). We found that most non-syntenic trans-eQTLs were treatment-specific whereas both classes of syntenic eQTLs were more conserved across treatments. We also found there was a correlation between regions along the genome enriched for eQTLs and SNPs that were conserved across the LXS and BXD families. Genes with eQTLs that co-localized with the behavioral QTLs and displayed similar QTL activity patterns were identified as potential candidate genes associated with the phenotypes, yielding identification of novel genes as well as genes that have been previously associated with responses to ethanol.
Conflict of interest statement
Figures


Similar articles
-
The abundance of cis-acting loci leading to differential allele expression in F1 mice and their relationship to loci harboring genes affecting complex traits.BMC Genomics. 2016 Aug 11;17(1):620. doi: 10.1186/s12864-016-2922-9. BMC Genomics. 2016. PMID: 27515598 Free PMC article.
-
QTL mapping for low-dose ethanol activation in the LXS recombinant inbred strains.Alcohol Clin Exp Res. 2006 Jul;30(7):1111-20. doi: 10.1111/j.1530-0277.2006.00137.x. Alcohol Clin Exp Res. 2006. PMID: 16792557
-
Genetic variation in hippocampal microRNA expression differences in C57BL/6 J X DBA/2 J (BXD) recombinant inbred mouse strains.BMC Genomics. 2012 Sep 13;13:476. doi: 10.1186/1471-2164-13-476. BMC Genomics. 2012. PMID: 22974136 Free PMC article.
-
Use of the expanded panel of BXD mice narrow QTL regions in ethanol-induced locomotor activation and motor incoordination.Alcohol Clin Exp Res. 2013 Jan;37(1):170-83. doi: 10.1111/j.1530-0277.2012.01865.x. Alcohol Clin Exp Res. 2013. PMID: 23289978
-
Integrated gene expression profiling and linkage analysis in the rat.Mamm Genome. 2006 Jun;17(6):480-9. doi: 10.1007/s00335-005-0181-1. Epub 2006 Jun 12. Mamm Genome. 2006. PMID: 16783629 Review.
Cited by
-
Genetic architecture of ethanol-responsive transcriptome variation in Saccharomyces cerevisiae strains.Genetics. 2014 Sep;198(1):369-82. doi: 10.1534/genetics.114.167429. Epub 2014 Jun 26. Genetics. 2014. PMID: 24970865 Free PMC article.
-
Linkage mapping of yeast cross protection connects gene expression variation to a higher-order organismal trait.PLoS Genet. 2018 Apr 12;14(4):e1007335. doi: 10.1371/journal.pgen.1007335. eCollection 2018 Apr. PLoS Genet. 2018. PMID: 29649251 Free PMC article.
-
Extensive cis-regulatory variation robust to environmental perturbation in Arabidopsis.Plant Cell. 2014 Nov;26(11):4298-310. doi: 10.1105/tpc.114.130310. Epub 2014 Nov 26. Plant Cell. 2014. PMID: 25428981 Free PMC article.
-
Joint mouse-human phenome-wide association to test gene function and disease risk.Nat Commun. 2016 Feb 2;7:10464. doi: 10.1038/ncomms10464. Nat Commun. 2016. PMID: 26833085 Free PMC article.
-
Distinct gene loci control the host response to influenza H1N1 virus infection in a time-dependent manner.BMC Genomics. 2012 Aug 20;13:411. doi: 10.1186/1471-2164-13-411. BMC Genomics. 2012. PMID: 22905720 Free PMC article.
References
-
- Rockman MV, Kruglyak L. Genetics of global gene expression. Nat Rev Genet. 2006;7:862. - PubMed
-
- Quigley D, Balmain A. Systems genetics analysis of cancer susceptibility: from mouse models to humans. Nat Rev Genet. 2009;10:651–657. - PubMed
-
- Emilsson V, Thorleifsson G, Zhang B, Leonardson AS, Zink F, et al. Genetics of gene expression and its effect on disease. Nature. 2008;452:423–428. - PubMed
Publication types
MeSH terms
Substances
Grants and funding
LinkOut - more resources
Full Text Sources
Molecular Biology Databases
Miscellaneous
