. 2012;7(2):e31962.
doi: 10.1371/journal.pone.0031962. Epub 2012 Feb 16.

Trafficking of high avidity HER-2/neu-specific T cells into HER-2/neu-expressing tumors after depletion of effector/memory-like regulatory T cells

Affiliations

Trafficking of high avidity HER-2/neu-specific T cells into HER-2/neu-expressing tumors after depletion of effector/memory-like regulatory T cells

Vivian L Weiss et al. PLoS One. 2012.

Abstract

Background: Cancer vaccines are designed to activate and enhance cancer-antigen-targeted T cells that are suppressed through multiple mechanisms of immune tolerance in cancer-bearing hosts. T regulatory cell (Treg) suppression of tumor-specific T cells is one barrier to effective immunization. A second mechanism is the deletion of high avidity tumor-specific T cells, which leaves a less effective low avidity tumor specific T cell repertoire available for activation by vaccines. Treg depleting agents including low dose cyclophosphamide (Cy) and antibodies that deplete CD25-expressing Tregs have been used with limited success to enhance the potency of tumor-specific vaccines. In addition, few studies have evaluated mechanisms that activate low avidity cancer antigen-specific T cells. Therefore, we developed high and low avidity HER-2/neu-specific TCR transgenic mouse colonies specific for the same HER-2/neu epitope to define the tolerance mechanisms that specifically affect high versus low avidity tumor-specific T cells.

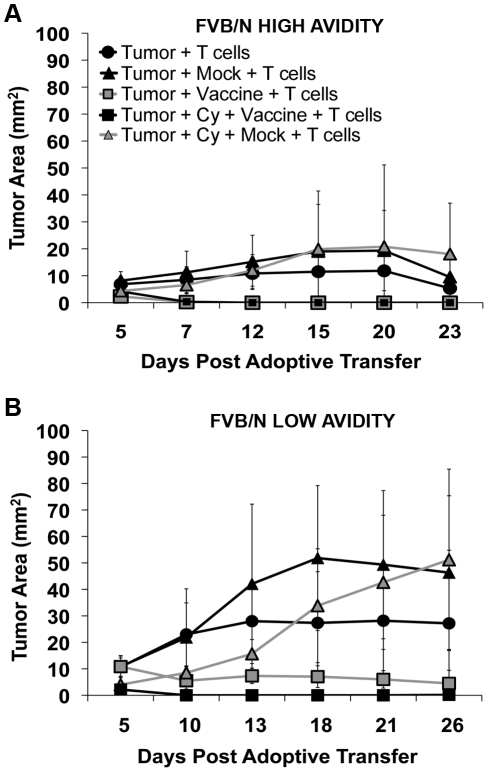
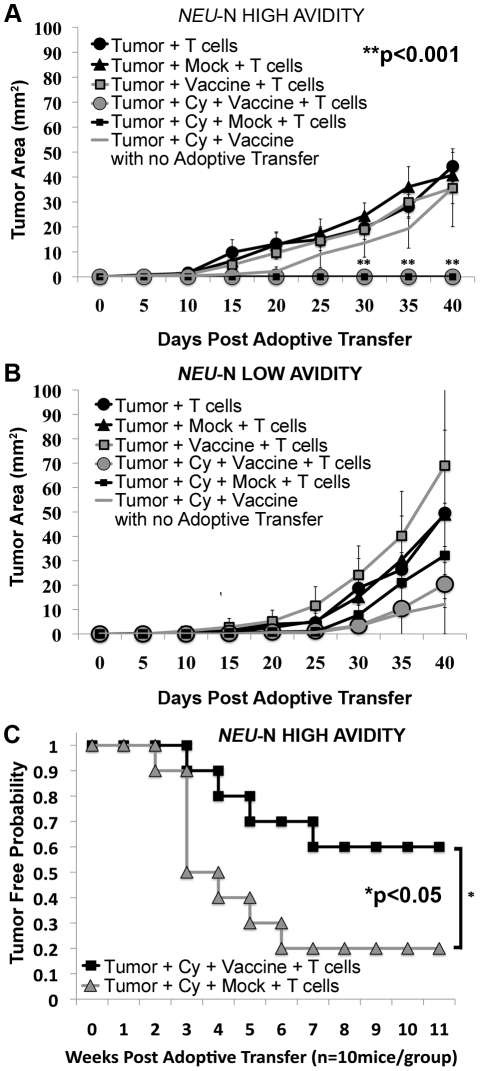
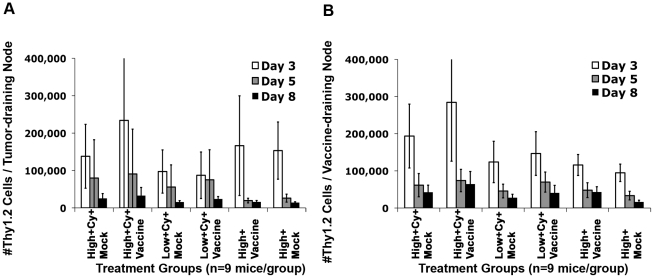
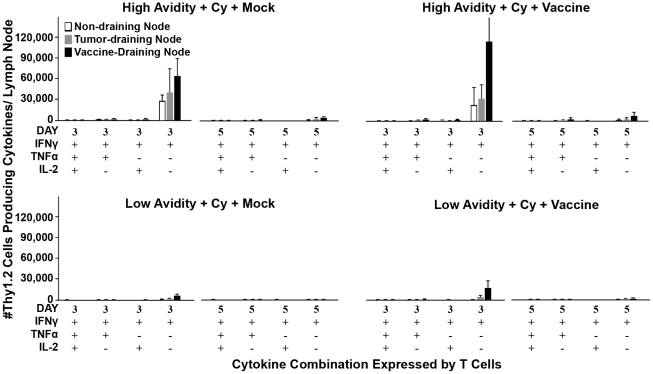
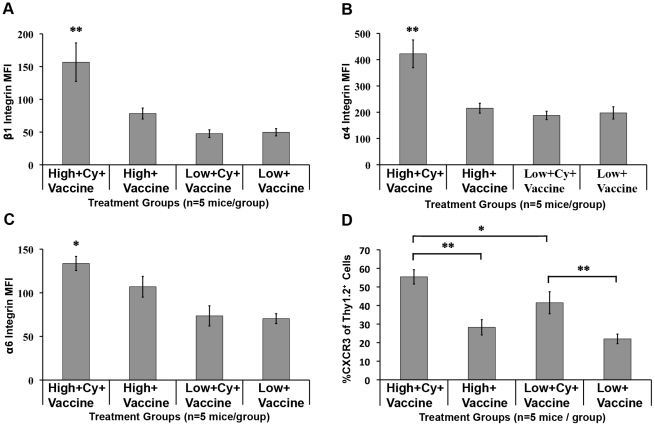
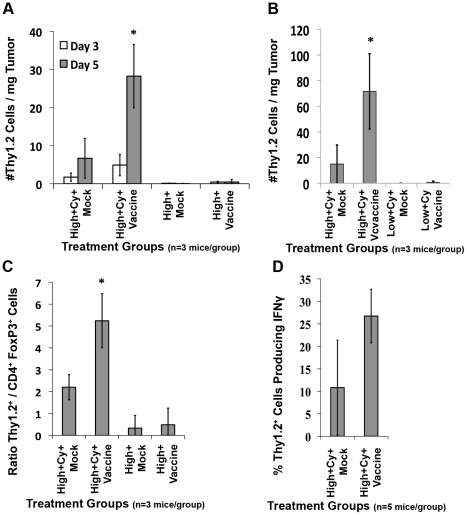
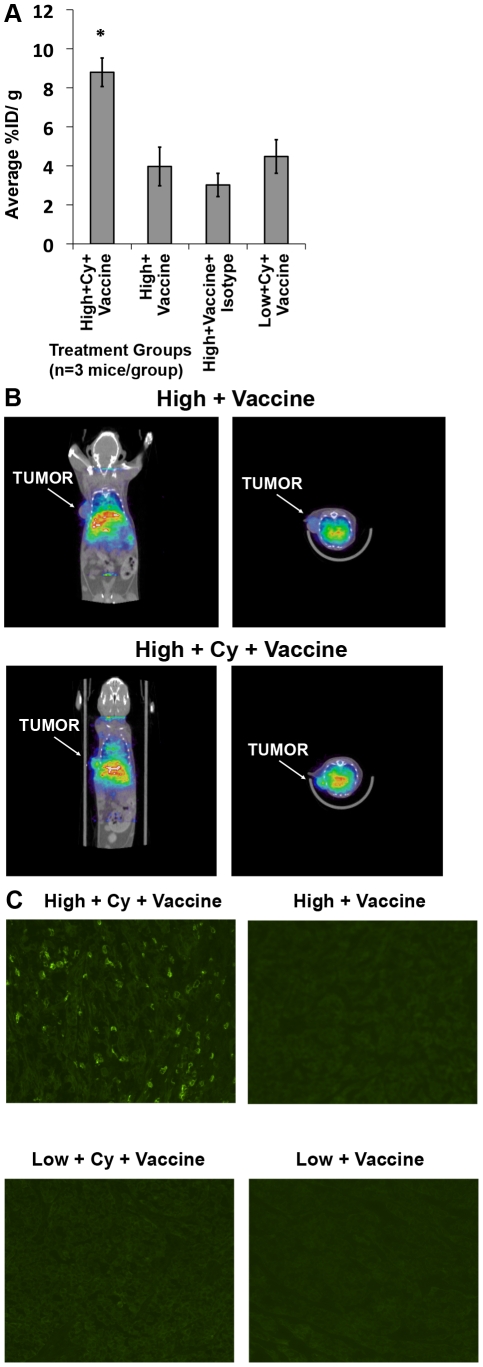
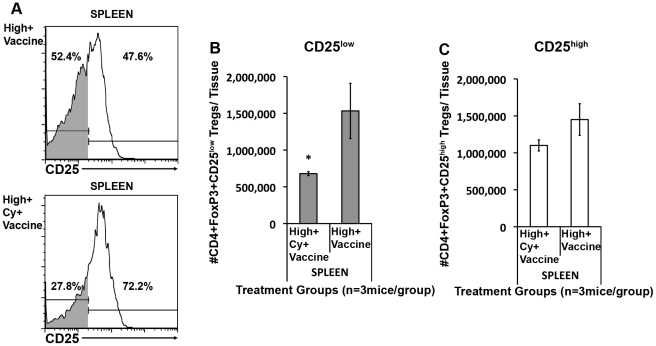
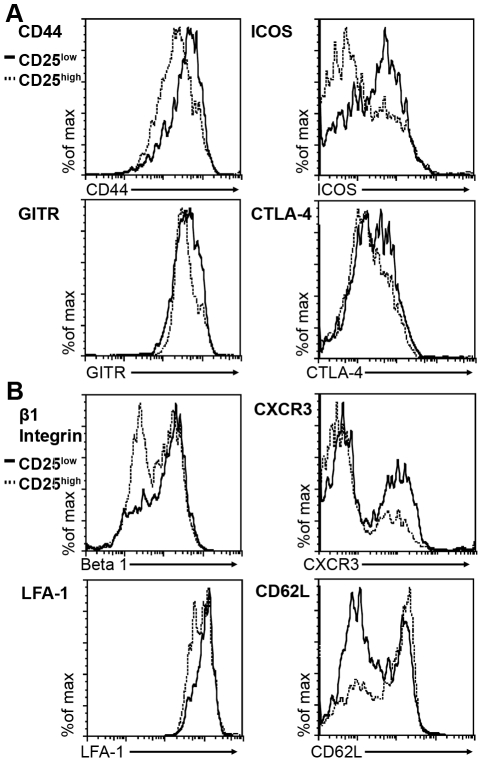
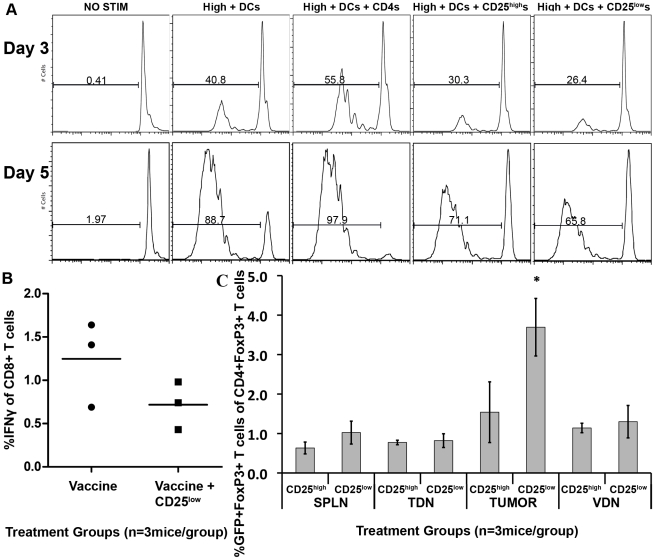
Methodology/principal findings: High and low avidity CD8(+) T cell receptor (TCR) transgenic mice specific for the breast cancer antigen HER-2/neu (neu) were developed to provide a purified source of naïve, tumor-specific T cells that can be used to study tolerance mechanisms. Adoptive transfer studies into tolerant FVB/N-derived HER-2/neu transgenic (neu-N) mice demonstrated that high avidity, but not low avidity, neu-specific T cells are inhibited by Tregs as the dominant tolerizing mechanism. High avidity T cells persisted, produced IFNγ, trafficked into tumors, and lysed tumors after adoptive transfer into mice treated with a neu-specific vaccine and low dose Cy to deplete Tregs. Analysis of Treg subsets revealed a Cy-sensitive CD4(+)Foxp3(+)CD25(low) tumor-seeking migratory phenotype, characteristic of effector/memory Tregs, and capable of high avidity T cell suppression.

Conclusion/significance: Depletion of CD25(low) Tregs allows activation of tumor-clearing high avidity T cells. Thus, the development of agents that specifically deplete Treg subsets should translate into more effective immunotherapies while avoiding autoimmunity.


Conflict of interest statement

Competing Interests: This work involves a GMCSF-secreting vaccine. Through a licensing agreement with BioSante, Johns Hopkins has the potential to receive royalties in the future. None of the authors of this paper have financial interests in this work. This does not alter the authors' adherence to all the PLoS ONE policies on sharing data and materials.

Figures

Figure 1
Figure 1. Adoptively transferred RNEU420–429-specific high avidity T cells enhance tumor clearance in FVB/N mice.
The minimal tumorigenic dose was given to FVB/N mice on day 0; Cy was given on day 2; vaccine or mock vaccine was injected on day 3; high avidity or low avidity T cells were adoptively transferred on day 4. Treatment groups are indicated in the figures. (A) Tumor growth after high avidity T cell adoptive transfer into FVB/N mice. (B) Tumor growth after low avidity T cell adoptive transfer into FVB/N mice. Data was graphed as the tumor area vs. days (figures 1 A–B) after adoptive transfer. * = p<0.05; ** = p<0.001. Experiments were repeated three times (n = 10 mice per group).
Figure 2
Figure 2. RNEU420–429-specific high avidity T cells enhance tumor clearance in neu-N mice given Cy and vaccine.
Neu-N mice were treated as in Figure 1 and the Methods. (A) Tumor growth after high avidity T cell adoptive transfer into neu-N mice. (B) Tumor growth after low avidity T cell adoptive transfer into neu-N mice. (C) Twice the minimum tumor dose was given to neu-N mice (1×10⁵ cells/mouse) on day 0. Data was graphed as the tumor free probability vs. weeks (Figure 2C) or tumor size (mm2) vs. days (figures 2A–B) after adoptive transfer. * = p<0.05; ** = p<0.001. Experiments were repeated three times (n = 10 mice per group).
Figure 3
Figure 3. High avidity T cells expand preferentially after adoptive transfer into Cy and vaccine-treated neu-N mice.
Mice were injected with 1×10⁶ tumor cells/mouse one week prior to Cy and vaccine treatment. High avidity or low avidity T cells were adoptively transferred one day after vaccination. (A) The absolute # of Thy1.2 T cells were calculated in the tumor draining lymph nodes (TDNs) of neu-N mice on day 3 (White bars), 5 (Gray bars), and 8 (Black bars) after adoptive transfer (n = 9 mice per group). (B) The absolute # of Thy1.2 T cells were calculated in the vaccine draining lymph nodes (VDNs) on day 3 (White bars), 5 (Gray bars), and 8 (Black bars) after adoptive transfer (n = 9 mice per group). Treatment groups are as indicated. High/low = High or low avidity T cells, respectively. Cy = Cytoxan treated. Vaccine = 3T3neuGM vaccine, Mock = 3T3GM control vaccine. Each experiment was repeated three times with similar results.
Figure 4
Figure 4. Enhanced cytokine secretion in high avidity T cells post-transfer into Cy and vaccine-treated neu-N mice.
On day 3 and day 5 after adoptive transfer, lymphocytes isolated from the non-draining lymph nodes (NDNs, White bars), VDNs (Black bars), and TDNs (Gray bars) were analyzed for the ability to secrete IFNγ, TNFα, and IL-2 secretion by ICS, and the absolute # of activated Thy1.2 cells was calculated (n = 3 mice per group). Treatment groups are as indicated. High/low = High or low avidity T cells, respectively. Cy = Cytoxan treated. Vaccine = 3T3neuGM vaccine, Mock = 3T3GM control vaccine. Each experiment was repeated three times with similar results.
Figure 5
Figure 5. Cy plus vaccine enhances VLA-4, VLA-6, and CXCR3 expression on high avidity T cells.
On day 3, TDN lymphocytes from neu-N mice were stained for (A) β1 integrin expression, (B) α4 integrin, or (C) α6 integrin, and the Mean Fluorescent Intensities (MFI) calculated. (n = 3mice/group). Isotype control MFIs were β1 integrin ∼20, α4 integrin ∼50–100, α6 integrin ∼30. (D) TDN lymphocytes from neu-N mice on day 5 were stained for CXCR3 and the %CXCR3+ of Thy1.2 cells was calculated (n = 5 mice/group). MFI isotype for CXCR3 is ∼10. * = p<0.05, ** = p<0.001. High/low = High or low avidity T cell transfer, respectively. Cy = Cyclophosphamide treatment. Vaccine = 3T3neuGM vaccine, Mock = 3T3GM control vaccine. Each experiment was repeated three times with similar results.
Figure 6
Figure 6. Cy-mediated Treg depletion increases high avidity T cell tumor trafficking in neu-N mice.
Neu-N mice were treated as in Figure 3 . (A and B) On day 3 (White bars) and day 5 (Gray bars) after adoptive transfer, the absolute number of Thy1.2+ cells/mg of tumor was calculated for each treatment group (n = 3 mice/group). (C) On day 5 after adoptive transfer the ratio of Thy1.2+ cells/CD4+Foxp3+ cells was calculated (n = 3 mice/group). (D) Lymphocytes from tumors on day 5 after adoptive transfer were stimulated as described in the methods and the %Thy1.2+ cells producing IFNγ after RNEU420–429 stimulation was calculated after NP stimulation was subtracted (n = 5mice/group). * = p<0.05. High/low = High or low avidity T cell transfer, respectively. Cy = Cyclophosphamide treatment. Vaccine = 3T3neuGM vaccine, Mock = 3T3GM control vaccine. Each experiment was repeated three times with similar results.
Figure 7
Figure 7. Confirmation of increased high avidity T cell tumor trafficking by in vivo imaging.
(A) Neu-N mice were tumor challenged and treated as in the Methods. One day after T cell adoptive transfer mice were treated with In-111 labeled anti-Thy1.2, the tumors isolated and the radiation content analyzed as described in Methods. Isotype = Isotype control treatment group. Tumor radioactivity concentration was reported as the average % injection dose/g of tumor (n = 3mice/group). (B) neu-N mice treated as in 7A, and underwent SPECT/CT imaging. Coronal (left panel) and transverse (right panel) cross-sections through the tumor are shown for each treatment. (C) Tumors were collected on day 5 after adoptive transfer and immunofluorescence stained for Thy 1.2. * = p<0.05. High/low = High or low avidity T cell transfer, respectively. Cy = Cyclophosphamide treatment. Vaccine = 3T3neuGM vaccine. Mock = 3T3GM Control Vaccine. These experiments were repeated 2–3 times with similar results.
Figure 8
Figure 8. Cy preferentially depletes CD25lowFoxp3+ Tregs.
Neu-N mice were treated as in Figure 3 and the Methods. Lymphocytes from spleens were collected on day 3. (A) CD4+Foxp3+ Tregs were analyzed for CD25 expression. Definition of CD25high vs. CD25low is based on isotype control. CD25low cells = gray fill under the histogram. (B) Absolute # CD25lowCD4+Foxp3+ Tregs calculated in spleens. (C) Absolute number of CD25highCD4+Foxp3+ Tregs calculated in spleens. High = high avidity T cell transfer, Cy = Cyclophosphamide treatment, Vaccine = 3T3neuGM vaccine treatment. * = p<0.05. These studies were repeated three times with similar results (n = 3 mice/group).
Figure 9
Figure 9. CD25lowFoxp3+ Tregs demonstrate an effector phenotype.
(A) CD4+Foxp3+CD25high and CD4+Foxp3+CD25low Tregs from high avidity T cell and vaccine treated mice analyzed for expression of ICOS, CTLA-4, GITR, and CD44. (B) CD25high and low Tregs were analyzed for β1 integrin, LFA-1, CD62L, and CXCR3. CD25high histograms = Black line. CD25low histograms = Dotted line. These studies were repeated three times with similar results (n = 3 mice/group).
Figure 10
Figure 10. CD25lowFoxp3+ Tregs suppress high avidity T cells and traffic preferentially to the tumor.
(A) CD25low and CD25high CD4+ Treg cells suppress high avidity T cell activation in vitro. CD25low or CD25high CD4+ FoxP3gfp+, DC, and CFSE-labeled high avidity Thy1.2+ CD8+ neu-specific T cells were mixed as described in the Methods. CFSE dilution was measured on days 3 and 5. CD4+ T cells from FVB/N mice were used as controls. High+DCs = High avidity T cells+DCs. High+DCs+CD4s = High avidity T cells+DCs+FVB/N CD4+ T cells, (B) CD25lowCD4+FoxP3+ Tregs trend toward suppression in vivo. neu-N/FoxP3gfp mice were given tumor and vaccinated as in the Methods. CD4+CD25low Tregs were isolated 1 week later and transferred to FVB/N-TgN(TIE2GFP)287Sato mice which were then vaccinated. CD8+ T cells were isolated 2 weeks later and tested for the ability to secrete IFNγ in response to RNEU420–429. Data are presented as % RNEU420–429-specific, IFNγ+ of CD8+ T cells. This experiment was done twice with similar results. (C) CD25low Tregs traffic preferentially to the tumor. neu-N mice received tumor and one week later received Cy, vaccine, 6×10⁶ high avidity T cells, and 5×10⁵ CD25low or CD25high CD4+GFP+ Tregs. On day 5 CD25low or CD25high CD4+GFP+ Tregs recovered from tumors, spleens, TDNs, and VDNs were enumerated as a fraction of the total # of FoxP3+ T cells at each site (n = 3mice/group). * = p<0.05. This experiment was repeated three times with similar results.

References

    1. Curotto de Lafaille MA, Lafaille JJ. Natural and adaptive foxp3+ regulatory T cells: more of the same or a division of labor? Immunity. 2009;30:626–635. - PubMed
    1. Dutoit V, Rubio-Godoy V, Dietrich PY, Quiqueres AL, Schnuriger V, et al. Heterogeneous T-cell response to MAGE-A10(254–262): high avidity-specific cytolytic T lymphocytes show superior antitumor activity. Cancer Res. 2001;61:5850–5856. - PubMed
    1. Mittendorf EA, Sharma P. Mechanisms of T-cell inhibition: implications for cancer immunotherapy. Expert Rev Vaccines. 2010;9:89–105. - PubMed
    1. Pardoll D. Does the immune system see tumors as foreign or self? Annu Rev Immunol. 2003;21:807–839. - PubMed
    1. Singh NJ, Schwartz RH. Primer: mechanisms of immunologic tolerance. Nat Clin Pract Rheumatol. 2006;2:44–52. - PubMed

Publication types