. 2012 Mar 5;51(5):2917-29.
doi: 10.1021/ic2021726. Epub 2012 Feb 23.

Structural, EPR, and Mössbauer characterization of (μ-alkoxo)(μ-carboxylato)diiron(II,III) model complexes for the active sites of mixed-valent diiron enzymes

Affiliations

Structural, EPR, and Mössbauer characterization of (μ-alkoxo)(μ-carboxylato)diiron(II,III) model complexes for the active sites of mixed-valent diiron enzymes

Feifei Li et al. Inorg Chem. .

Abstract

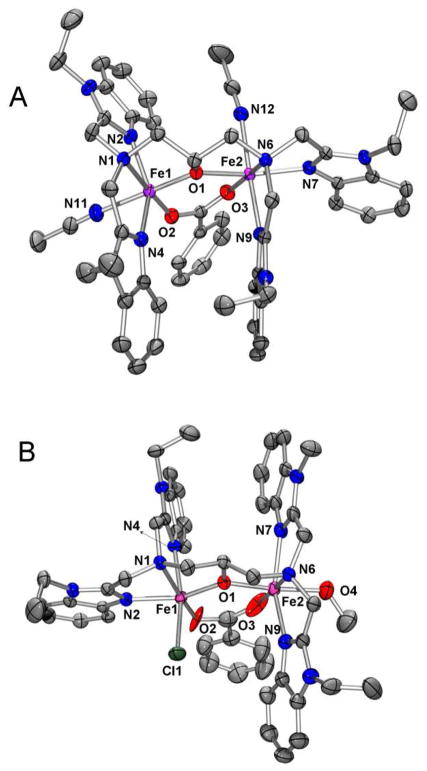
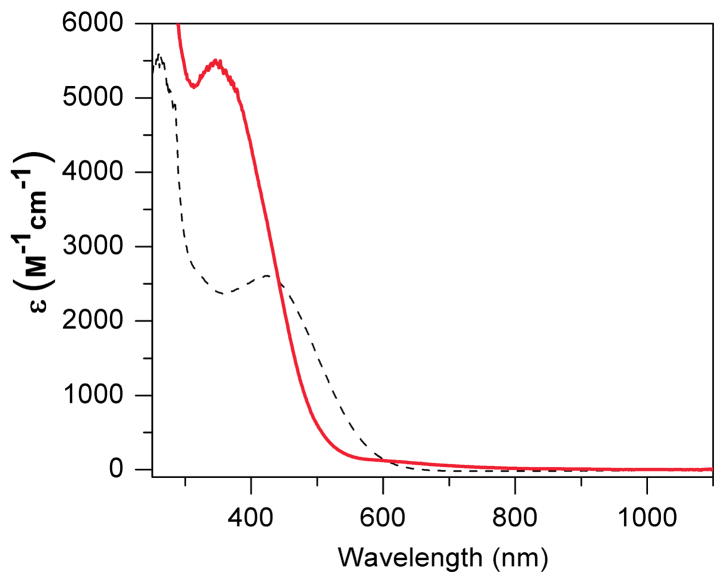
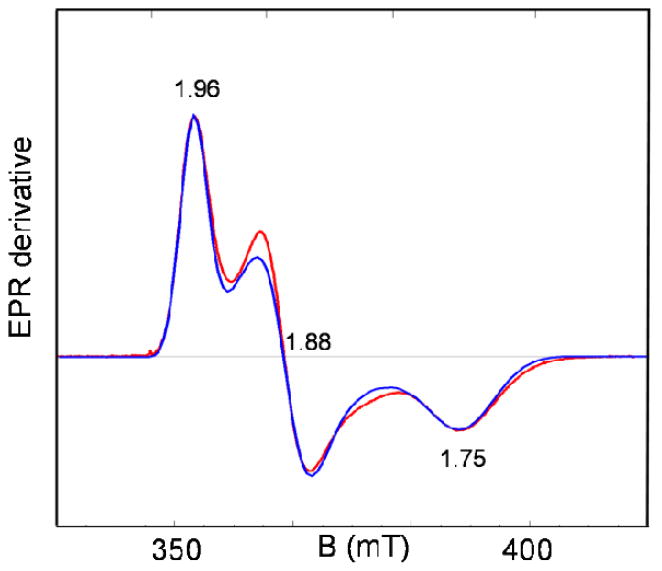
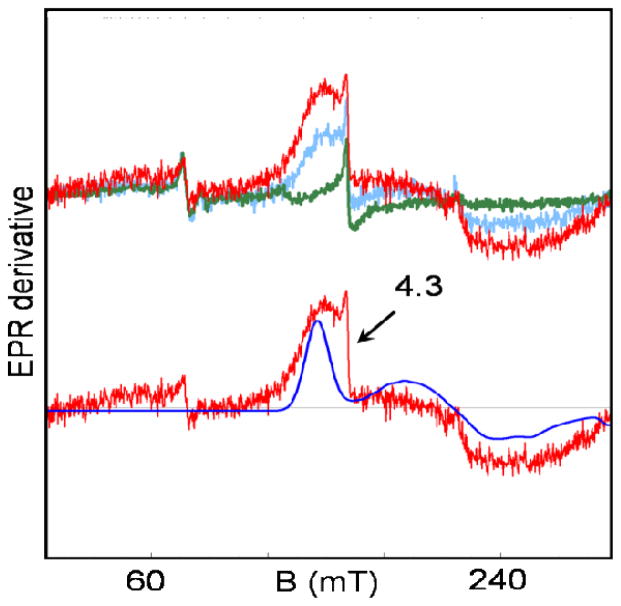
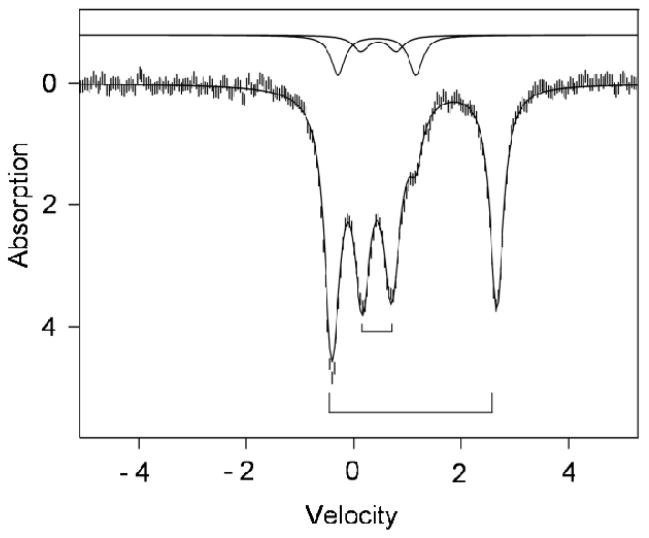
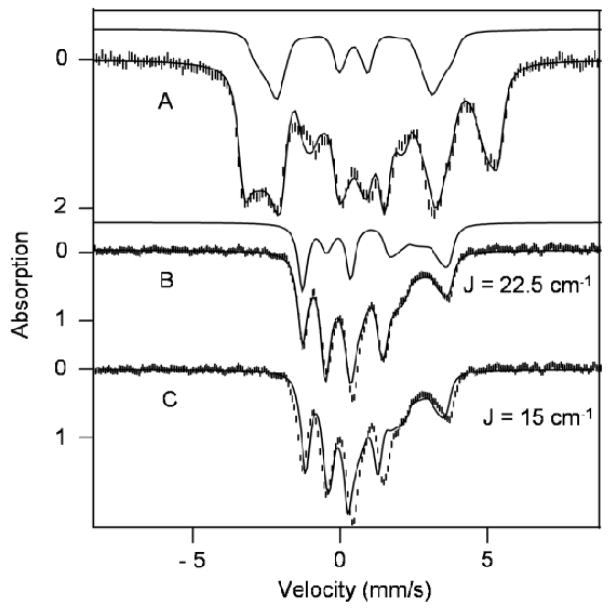
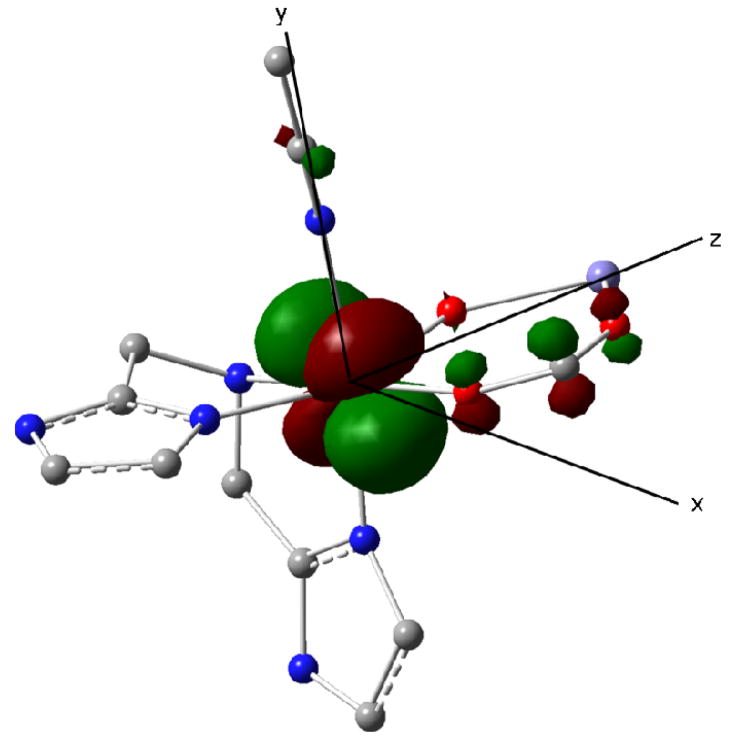
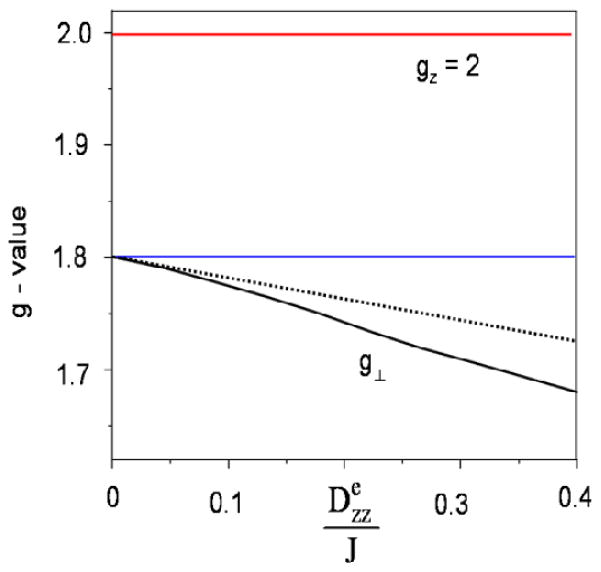
To obtain structural and spectroscopic models for the diiron(II,III) centers in the active sites of diiron enzymes, the (μ-alkoxo)(μ-carboxylato)diiron(II,III) complexes [Fe(II)Fe(III)(N-Et-HPTB)(O(2)CPh)(NCCH(3))(2)](ClO(4))(3) (1) and [Fe(II)Fe(III)(N-Et-HPTB)(O(2)CPh)(Cl)(HOCH(3))](ClO(4))(2) (2) (N-Et-HPTB = N,N,N',N'-tetrakis(2-(1-ethyl-benzimidazolylmethyl))-2-hydroxy-1,3-diaminopropane) have been prepared and characterized by X-ray crystallography, UV-visible absorption, EPR, and Mössbauer spectroscopies. Fe1-Fe2 separations are 3.60 and 3.63 Å, and Fe1-O1-Fe2 bond angles are 128.0° and 129.4° for 1 and 2, respectively. Mössbauer and EPR studies of 1 show that the Fe(III) (S(A) = 5/2) and Fe(II) (S(B) = 2) sites are antiferromagnetically coupled to yield a ground state with S = 1/2 (g= 1.75, 1.88, 1.96); Mössbauer analysis of solid 1 yields J = 22.5 ± 2 cm(-1) for the exchange coupling constant (H = JS(A)·S(B) convention). In addition to the S = 1/2 ground-state spectrum of 1, the EPR signal for the S = 3/2 excited state of the spin ladder can also be observed, the first time such a signal has been detected for an antiferromagnetically coupled diiron(II,III) complex. The anisotropy of the (57)Fe magnetic hyperfine interactions at the Fe(III) site is larger than normally observed in mononuclear complexes and arises from admixing S > 1/2 excited states into the S = 1/2 ground state by zero-field splittings at the two Fe sites. Analysis of the "D/J" mixing has allowed us to extract the zero-field splitting parameters, local g values, and magnetic hyperfine structural parameters for the individual Fe sites. The methodology developed and followed in this analysis is presented in detail. The spin Hamiltonian parameters of 1 are related to the molecular structure with the help of DFT calculations. Contrary to what was assumed in previous studies, our analysis demonstrates that the deviations of the g values from the free electron value (g = 2) for the antiferromagnetically coupled diiron(II,III) core in complex 1 are predominantly determined by the anisotropy of the effective g values of the ferrous ion and only to a lesser extent by the admixture of excited states into ground-state ZFS terms (D/J mixing). The results for 1 are discussed in the context of the data available for diiron(II,III) clusters in proteins and synthetic diiron(II,III) complexes.


Figures

Figure 1
Figure 1
The substrate-bound active site of mouse MIOX (2HUO).
Figure 2
Figure 2
Thermal ellipsoid plots of A) [FeIIFeIII(N-Et-HPTB)(O2CPh)(NCCH3)2]3+ (1) and B) [FeIIFeIII(N-Et-HPTB)(O2CPh)(Cl)(HOCH3)]2+ (2) showing 50% probability thermal ellipsoids for all non-hydrogen atoms. H-atoms omitted for clarity. In both complex 1 and 2, Fe1 is FeIII and Fe2 is FeII.
Figure 3
Figure 3
Electronic spectrum of 1 (black dotted line) and 2 (red solid line) in CH3CN at 298 K.
Figure 4
Figure 4
EPR spectrum of 1 in PrCN recorded at T = 8 K. The theoretical curve (red) was generated for gx = 1.75, gy = 1.88 and gz = 1.96 using the strain parameters σx = 0.025, σy = 0.015 and σz = 0.012. Below, we relate x, y, and z to the molecular frame. Conditions: 9.62 GHz; 20 μW microwave power; 1 mT modulation.
Figure 5
Figure 5
EPR spectra of 1 in PrCN in the low field region recorded at T = 8 K (green), 21 K (blue) and 34 K (red). The blue line in the lower trace is a simulation of the 34 K spectrum with eq 1, using the parameters listed in Table 4. To simulate the approximate line shape, EB/DB was assumed to have a Gaussian distribution with σE/D = 0.04. The feature at g = 4.3 is due to a minor S = 5/2 contaminant. Conditions: 9.62 GHz, 0.2 mW microwave power, 1 mT modulation; 1 hour accumulation time for the 34 K spectrum.
Figure 6
Figure 6
Mössbauer spectrum of solid 1 recorded at 120 K in zero applied field. The solid line through the data is a simulation involving doublets for ferric site A (43% of Fe, inner bracket), ferrous site B (43%, outer bracket). The solid lines shown above the data indicate the spectra of two diferric contaminants (ΔEQ = 1.40 mm/s, δ = 0.43 mm/s, 10%; ΔEQ = 0.66 mm/s, δ = 0.46 mm/s, 4%). Parameters for sites A and B are quoted in Tables 3 and 4.
Figure 7
Figure 7
Mössbauer spectra of solid 1 recorded at 1.8 K (A) and 120 K (B) in a parallel field of 7.63 T. The solid lines through the data are spectral simulations based on eq 1, using the parameters listed in Table 4. The solid line above (A) shows the contribution of the FeIII site, FeA. The solid line above (B) indicates the contribution of the ferrous site, FeB. The spectrum in (C) is the same as that shown in (B); the theoretical curve, however, was generated for J = 15 cm−1 rather than J = 22.5 cm−1.
Figure 8
Figure 8
Lowest 3d orbital (doubly occupied) of the FeII site of 1 obtained by DFT. The orbital has t2g parentage and has xy character when the z axis is chosen along the Fe-Fe direction and the y axis is along Fe-NMeCN. For clarity, the ligands of the FeIII site and some additional atoms have been removed.
Figure 9
Figure 9
Illustration of D/J mixing on the effective g-values of an FeIIIFeII system. For clarity we have made the following simplifying assumptions. Dxxe=Dyye=Dzze/2;gxB=gyB=2.15,gzB=2.0,gA=2.00. The solid lines in black and red were obtained by diagonalization of eq 1. The dashed line for gx = gy = g was generated by using the perturbation expression of eq 8. The difference between the blue horizontal line at g=4gx,yB/3=1.80 and the solid line for g is due to D/J mixing.

Similar articles

Cited by

References

    1. Wallar BJ, Lipscomb JD. Chem Rev. 1996;96:2625–2658. - PubMed
    1. Stenkamp RE. Chem Rev. 1994;94:715–726.
    1. Xiong J, Kurtz DM, Jr, Ai J, Sanders-Loehr J. Biochemistry. 2000;39:5117–5125. - PubMed
    1. Salahudeen AA, Thompson JW, Ruiz JC, Ma HW, Kinch LN, Li Q, Grishin NV, Bruick RK. Science. 2009;326:722–726. - PMC - PubMed
    1. Tinberg CE, Lippard SJ. Acc Chem Res. 2011;44:280–288. - PMC - PubMed

Publication types