

Tissue factor-positive monocytes in children with sickle cell disease: correlation with biomarkers of haemolysis
- PMID: 22360627
- PMCID: PMC3323750
- DOI: 10.1111/j.1365-2141.2012.09065.x
Tissue factor-positive monocytes in children with sickle cell disease: correlation with biomarkers of haemolysis
Abstract
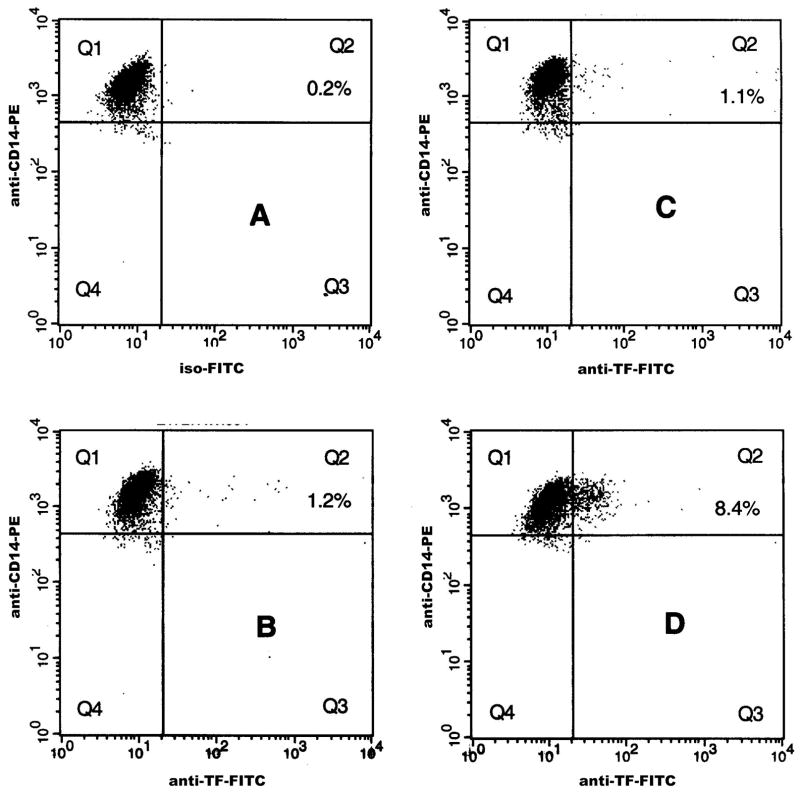
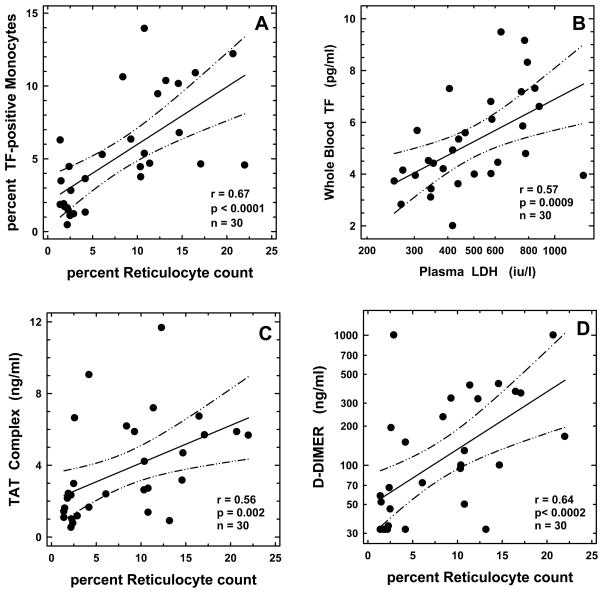
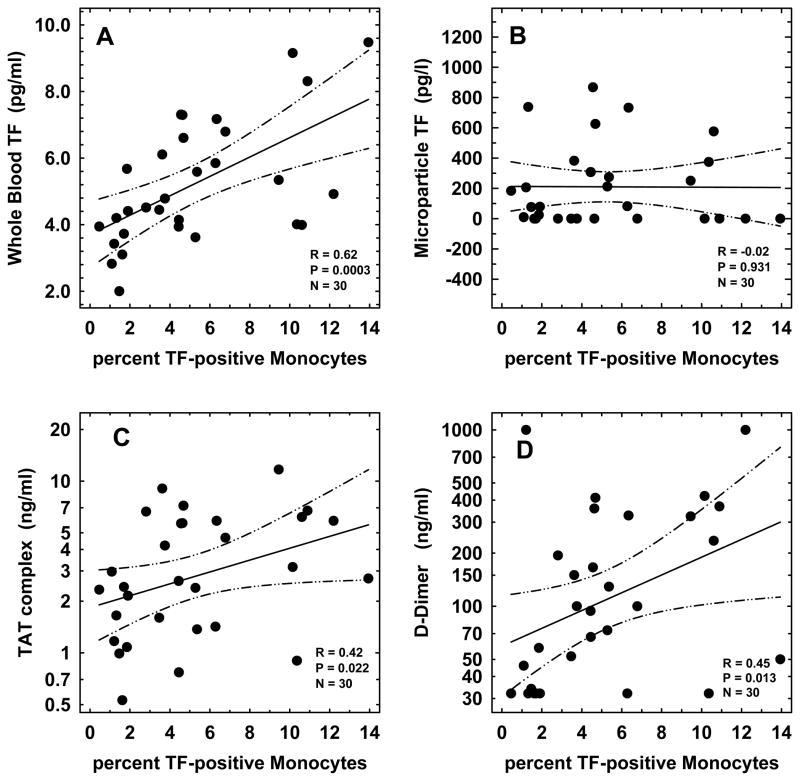
Tissue Factor (TF) initiates thrombin generation, and whole blood TF (WBTF) is elevated in sickle cell disease (SCD). We sought to identify the presence of TF-positive monocytes in SCD and their relationship with the other coagulation markers including WBTF, microparticle-associated TF, thrombin-antithrombin (TAT) complexes and D-dimer. Whether major SCD-related pathobiological processes, including haemolysis, inflammation and endothelial activation, contribute to the coagulation abnormalities was also studied. The cohort comprised children with SCD (18 HbSS, 12 HbSC, mean age 3·6 years). We demonstrated elevated levels of TF-positive monocytes in HbSS, which correlated with WBTF, TAT and D-dimer (P = 0·02 to P = 0·0003). While TF-positive monocytes, WBTF, TAT and D-dimer correlated with several biomarkers of haemolysis, inflammation and endothelial activation in univariate analyses, in multiple regression models the haemolytic markers (reticulocytes and lactate dehydrogenase) contributed exclusively to the association with all four coagulant markers evaluated. The demonstration that haemolysis is the predominant operative pathology in the associated perturbations of coagulation in HbSS at a young age provides additional evidence for the early use of therapeutic agents, such as hydroxycarbamide to reduce the haemolytic component of this disease.
© 2012 Blackwell Publishing Ltd.
Conflict of interest statement
We declare that we have no conflict of interest.
Figures
References
-
- Adedeji MO, Cespedes J, Allen K, Subramony C, Hughson MD. Pulmonary thrombotic arteriopathy in patients with sickle cell disease. Archives of Pathology and Laboratory Medicine. 2001;125:1436–1441. - PubMed
-
- Ataga KI, Cappellini MD, Rachmilewitz EA. β-Thalassaemia and sickle cell anaemia as paradigms of hypercoagulabilty. British Journal of Haematology. 2007;139:3–13. - PubMed
-
- Belcher JD, Marker PH, Weber JP, Hebbel RP, Vercellotti GM. Activated monocyes in sickle cell disease: potential role in the activation of vascular endothelium and vaso-occlution. Blood. 2000;96:2451–2459. - PubMed
-
- Blann AD, Mohan JS, Bareford D, Lip GY. Soluble P-selectin and vascular endothelial growth factor in steady state sickle cell disease: relationship to genotype. Journal of Thrombosis and Thrombolysis. 2008;25:185–189. - PubMed
Publication types
MeSH terms
Substances
Grants and funding
LinkOut - more resources
Full Text Sources
Medical
Miscellaneous
