Randomized Controlled Trial
. 2012 Mar;5(2):251-61.
doi: 10.1161/CIRCIMAGING.111.969923. Epub 2012 Feb 23.

Determinants of left ventricular mass in patients on hemodialysis: Frequent Hemodialysis Network (FHN) Trials

Affiliations
Randomized Controlled Trial

Determinants of left ventricular mass in patients on hemodialysis: Frequent Hemodialysis Network (FHN) Trials

Christopher T Chan et al. Circ Cardiovasc Imaging. 2012 Mar.

Abstract

Background: An increase in left ventricular mass (LVM) is associated with mortality and cardiovascular morbidity in patients with end-stage renal disease.

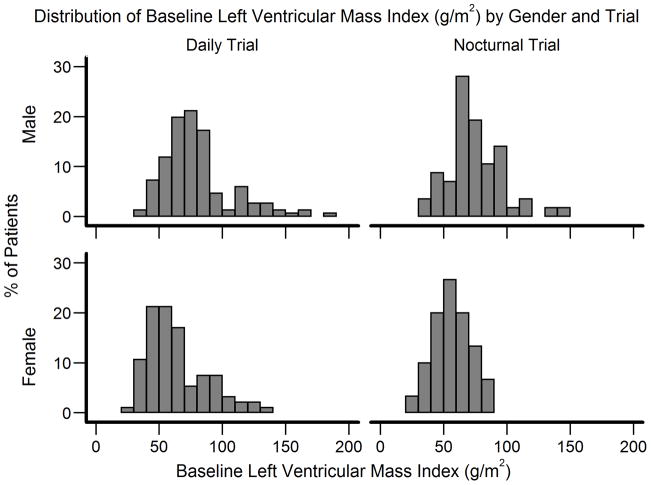
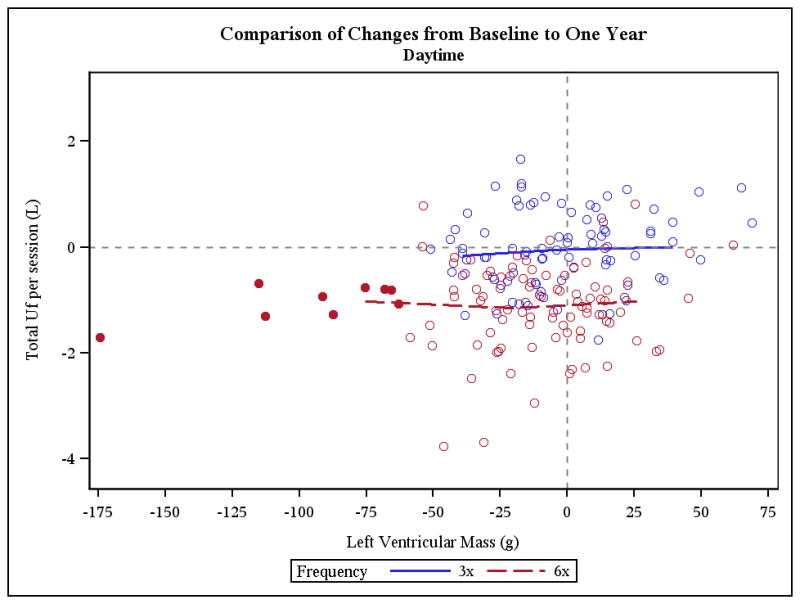
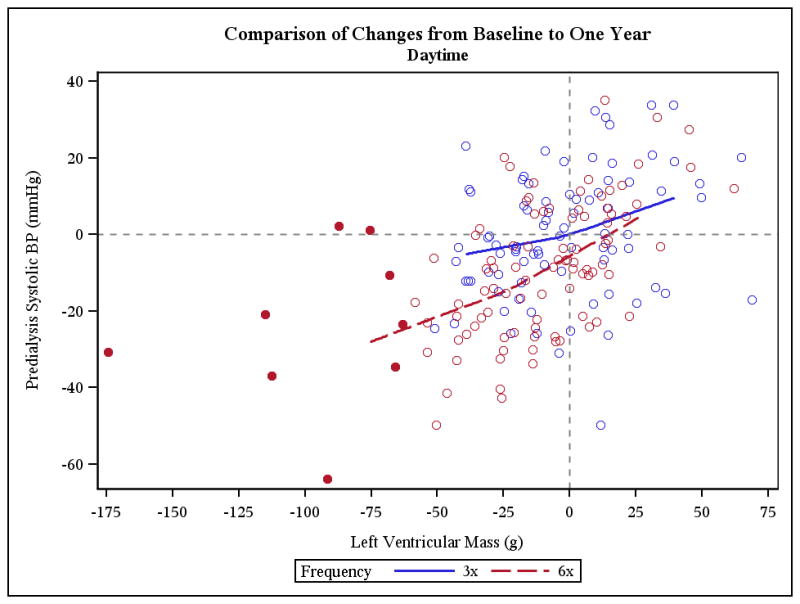
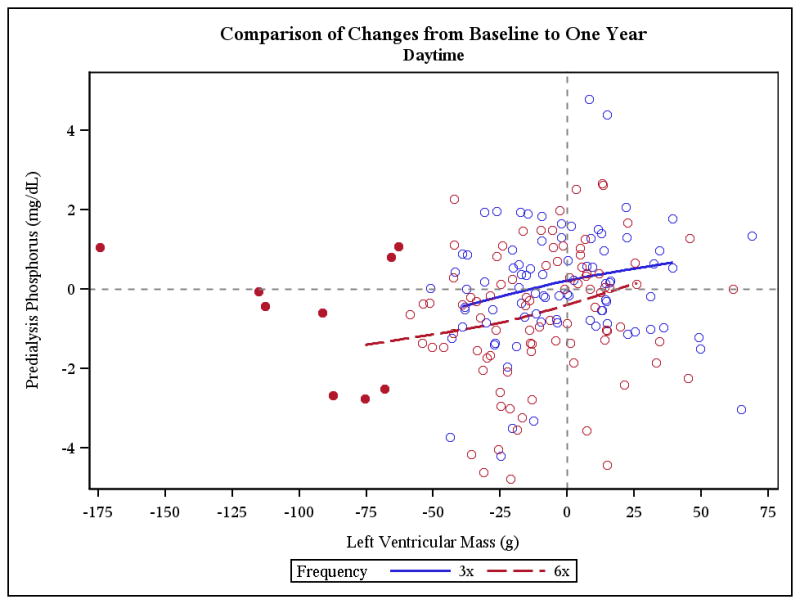
Methods and results: The Frequent Hemodialysis Network (FHN) Daily Trial randomized 245 patients to 12 months of 6 times per week daily in-center hemodialysis or conventional hemodialysis; the FHN Nocturnal Trial randomized 87 patients to 12 months of 6 times per week nocturnal hemodialysis or conventional hemodialysis. The main cardiac secondary outcome was change in LVM. In each trial, we examined whether several predefined baseline demographic or clinical factors as well as change in volume removal, blood pressure, or solute clearance influenced the effect of frequent hemodialysis on LVM. In the Daily Trial, frequent hemodialysis resulted in a significant reduction in LVM (13.1 g; 95% CI, 5.0-21.3 g; P=0.002), LVM index (6.9 g/m(2); 95% CI, 2.4-11.3 g/m(2); P=0.003), and percent change in geometric mean of LVM (7.0%; 95% CI, 1.0%-12.6; P=0.02). Similar trends were noted in the Nocturnal Trial but did not reach statistical significance. In the Daily Trial, a more pronounced effect of frequent hemodialysis on LVM was evident among patients with left ventricular hypertrophy at baseline. Changes in LVM were associated with changes in blood pressure (conventional hemodialysis: R=0.28, P=0.01, daily hemodialysis: R=0.54, P<0.001) and were not significantly associated with changes in other parameters.

Conclusions: Frequent in-center hemodialysis reduces LVM. The benefit of frequent hemodialysis on LVM may be mediated by salutary effects on blood pressure. Clinical Trial Registration- URL: http://www.clinicaltrials.gov. Unique identifier: NCT00264758.


Figures

Figure 1
Figure 1
Histograms describing the baseline distribution of LV mass index divided by gender in the Daily and Nocturnal Trials. LVH was defined as LVM index (LVM/body surface area) > 84.1 g/m2 (male) or >66.8 g/m2 (female) according to Alfakih et al.
Figure 2
Figure 2
The effect of baseline left ventricular mass on the change in left ventricular mass in the Daily Trial.
Figure 2
Figure 2
The effect of baseline left ventricular mass on the change in left ventricular mass in the Daily Trial.
Figure 3
Figure 3
Figure 3A: Closed circles indicate patients with reductions in LV mass greater than 60 g between baseline and 12 months. Although LV mass may be viewed as the response variable in this relationship, we have plotted LV mass on the horizontal axis in Figures 3A–3C to better display the role of these outliers with large LV mass reductions. Correlations between changes in net volume removal and changes in LVM in the Daily Trial (3 Times/Week hemodialysis: Pearson R=0.15, P=0.16, 6 Times/Week hemodialysis: R=0.06, P=0.54) and Nocturnal Trial (3 Times/Week hemodialysis: R=−0.20, P=0.24, 6 Times/Week hemodialysis: R=−0.11, P=0.54) Figure 3B: Correlations between changes in pre-dialysis systolic blood pressures and changes in LVM in the Daily Trial (3 Times/Week hemodialysis: R=0.28, P=0.01, 6 Times/Week hemodialysis: R=0.54, P<0.001) and Nocturnal Trial (3 Times/Week hemodialysis: R=0.14, P=0.41, 6 Times/Week hemodialysis: R=0.51, P<0.001) Figure 3C: Correlations between changes in pre-dialysis serum phosphorus and changes in LVM in the Daily Trial (3 Times/Week hemodialysis: R=0.11, P=0.30, 6 Times/Week hemodialysis: R=0.1, P=0.35) and Nocturnal Trial (3 Times/Week hemodialysis: R=0.12, P=0.46, 6 Times/Week hemodialysis: R=−0.23, P=0.18)
Figure 3
Figure 3
Figure 3A: Closed circles indicate patients with reductions in LV mass greater than 60 g between baseline and 12 months. Although LV mass may be viewed as the response variable in this relationship, we have plotted LV mass on the horizontal axis in Figures 3A–3C to better display the role of these outliers with large LV mass reductions. Correlations between changes in net volume removal and changes in LVM in the Daily Trial (3 Times/Week hemodialysis: Pearson R=0.15, P=0.16, 6 Times/Week hemodialysis: R=0.06, P=0.54) and Nocturnal Trial (3 Times/Week hemodialysis: R=−0.20, P=0.24, 6 Times/Week hemodialysis: R=−0.11, P=0.54) Figure 3B: Correlations between changes in pre-dialysis systolic blood pressures and changes in LVM in the Daily Trial (3 Times/Week hemodialysis: R=0.28, P=0.01, 6 Times/Week hemodialysis: R=0.54, P<0.001) and Nocturnal Trial (3 Times/Week hemodialysis: R=0.14, P=0.41, 6 Times/Week hemodialysis: R=0.51, P<0.001) Figure 3C: Correlations between changes in pre-dialysis serum phosphorus and changes in LVM in the Daily Trial (3 Times/Week hemodialysis: R=0.11, P=0.30, 6 Times/Week hemodialysis: R=0.1, P=0.35) and Nocturnal Trial (3 Times/Week hemodialysis: R=0.12, P=0.46, 6 Times/Week hemodialysis: R=−0.23, P=0.18)

References

    1. Foley RN, Collins AJ. End-stage renal disease in the United States: an update from the United States Renal Data System. J Am Soc Nephrol. 2007;18:2644–2648. - PubMed
    1. Zoccali C, Benedetto FA, Mallamaci F, Tripepi G, Giacone G, Stancanelli B, Cataliotti A, Malatino LS. Left ventricular mass monitoring in the follow-up of dialysis patients: prognostic value of left ventricular hypertrophy progression. Kidney Int. 2004;65:1492–1498. - PubMed
    1. London GM. Cardiovascular disease in chronic renal failure: pathophysiologic aspects. Semin Dial. 2003;16:85–94. - PubMed
    1. Foley RN. Clinical epidemiology of cardiac disease in dialysis patients: left ventricular hypertrophy, ischemic heart disease, and cardiac failure. Semin Dial. 2003;16:111–117. - PubMed
    1. Zoccali C, Mallamaci F, Tripepi G. Traditional and emerging cardiovascular risk factors in end-stage renal disease. Kidney Int Suppl. 2003:105–110. - PubMed

Publication types

MeSH terms

Associated data