

A rule-based seizure prediction method for focal neocortical epilepsy
- PMID: 22361267
- PMCID: PMC3361618
- DOI: 10.1016/j.clinph.2012.01.014
A rule-based seizure prediction method for focal neocortical epilepsy
Abstract
Objective: In the present study, we have developed a novel patient-specific rule-based seizure prediction system for focal neocortical epilepsy.
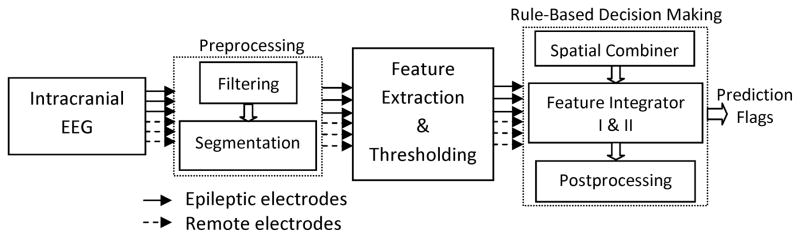
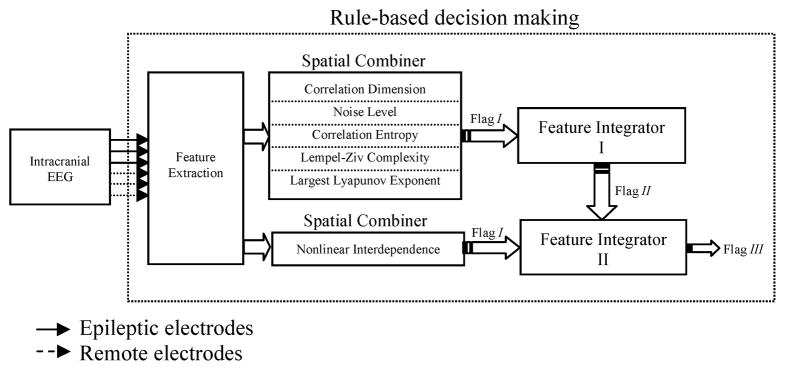
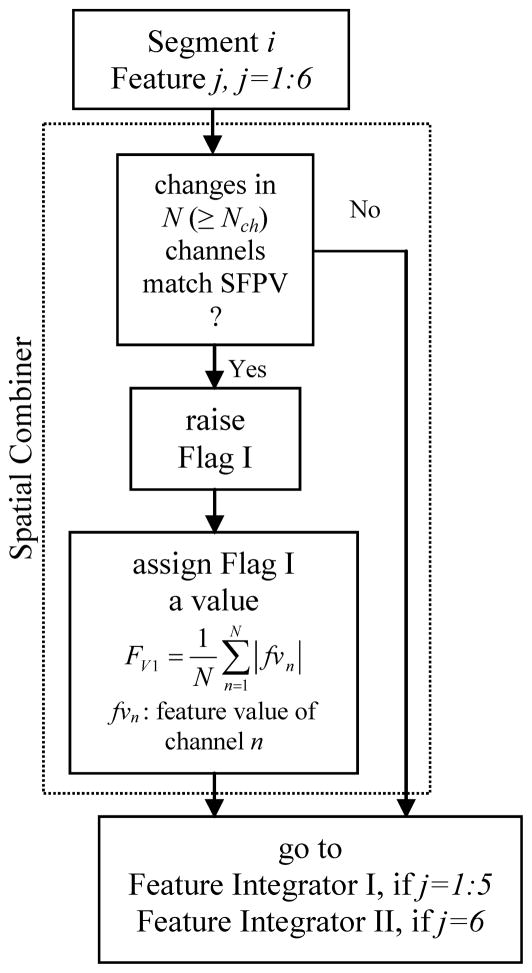
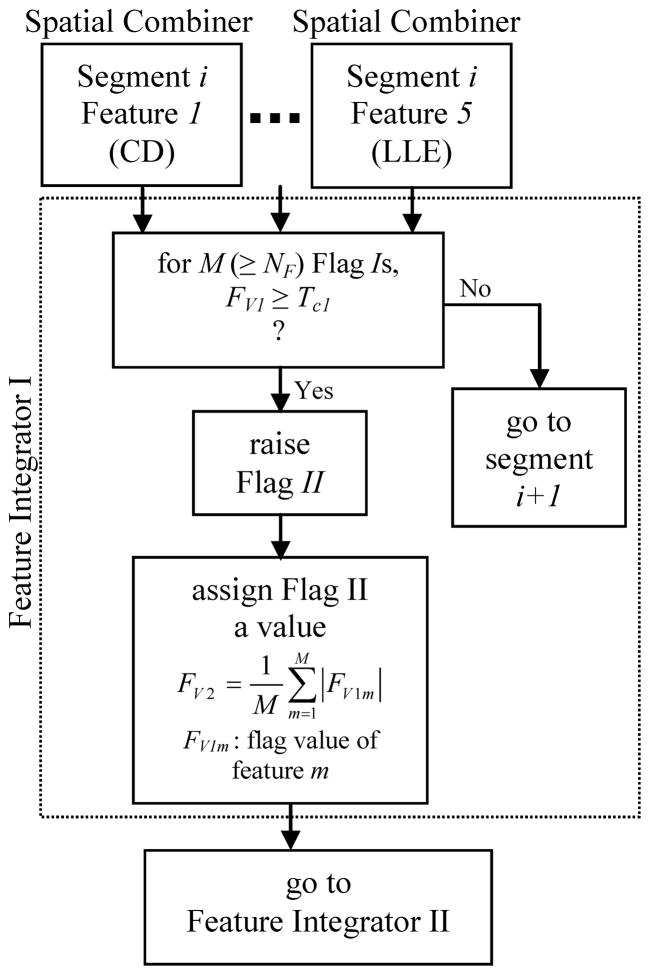
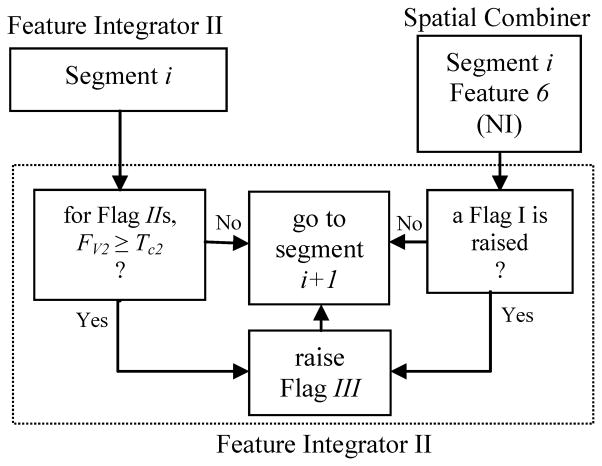
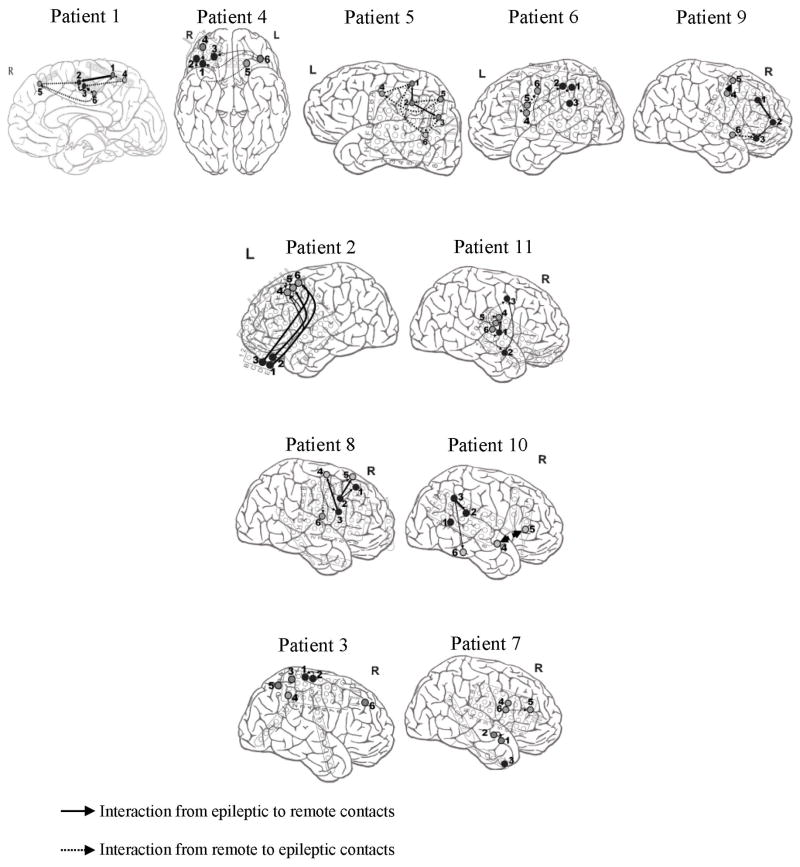
Methods: Five univariate measures including correlation dimension, correlation entropy, noise level, Lempel-Ziv complexity, and largest Lyapunov exponent as well as one bivariate measure, nonlinear interdependence, were extracted from non-overlapping 10-s segments of intracranial electroencephalogram (iEEG) data recorded using electrodes implanted deep in the brain and/or placed on the cortical surface. The spatio-temporal information was then integrated by using rules established based on patient-specific changes observed in the period prior to a seizure sample for each patient. The system was tested on 316 h of iEEG data containing 49 seizures recorded in 11 patients with medically intractable focal neocortical epilepsy.
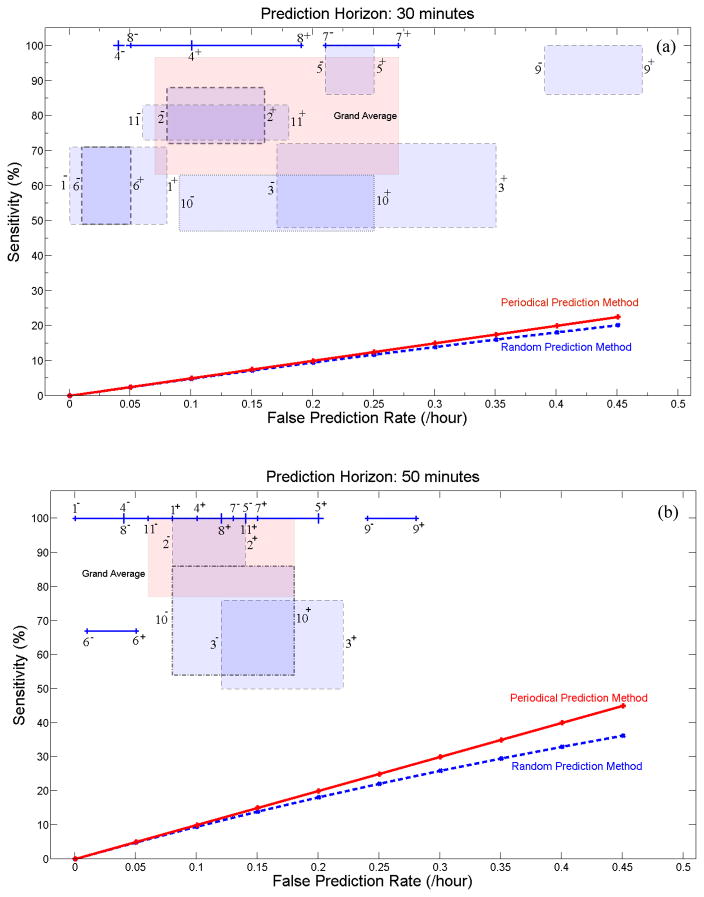
Results: For seizure occurrence periods of 30 and 50 min our method showed an average sensitivity of 79.9% and 90.2% with an average false prediction rate of 0.17 and 0.11/h, respectively. In terms of sensitivity and false prediction rate, the system showed superiority to random and periodical predictors.
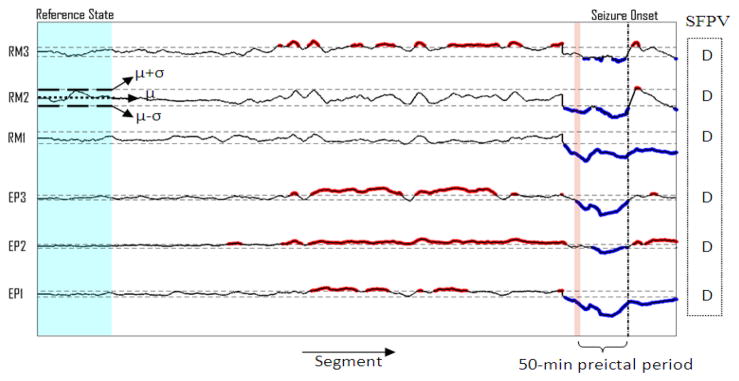
Conclusions: The nonlinear analysis of iEEG in the period prior to seizures revealed patient-specific spatio-temporal changes that were significantly different from those observed within baselines in the majority of the seizures analyzed in this study.
Significance: The present results suggest that the patient specific rule-based approach may become a potentially useful approach for predicting seizures prior to onset.
Copyright © 2012 International Federation of Clinical Neurophysiology. Published by Elsevier Ireland Ltd. All rights reserved.
Figures
References
-
- Aboy M, Hornero R, Abasolo D, Alvarez D. Interpretation of the Lempel-Ziv complexity measure in the context of biomedical signal analysis. IEEE Trans Biomed Eng. 2006;53:2282–8. - PubMed
-
- Albano AM, Muench J, Schwartz C, Mees AI, Rapp PE. Singular-value decomposition and the Grassberger-Procaccia algorithm. Phys Rev A. 1988;38:3017–26. - PubMed
-
- Arnhold J, Grassberger P, Lehnertz K, Elger CE. A robust method for detecting interdependencies: application to intracranially recorded EEG. Physica D. 1999;134:419–30.
-
- Aschenbrenner-Scheibe R, Maiwald T, Winterhalder M, Voss HU, Timmer J, Schulze-Bonhage A. How well can epileptic seizures be predicted? An evaluation of a nonlinear method. Brain. 2003;126:2616–26. - PubMed
-
- Browne TR, Holmes GL. Handbook of Epilepsy. 4. Lippincott Williams & Wilkins; USA: 2008.
Publication types
MeSH terms
Grants and funding
LinkOut - more resources
Full Text Sources
Other Literature Sources
Medical
