. 2012 May;32(4):613-24.
doi: 10.1007/s10571-012-9808-4. Epub 2012 Feb 24.

Cell selective conditional null mutations of serine racemase demonstrate a predominate localization in cortical glutamatergic neurons

Affiliations

Cell selective conditional null mutations of serine racemase demonstrate a predominate localization in cortical glutamatergic neurons

Michael A Benneyworth et al. Cell Mol Neurobiol. 2012 May.

Abstract

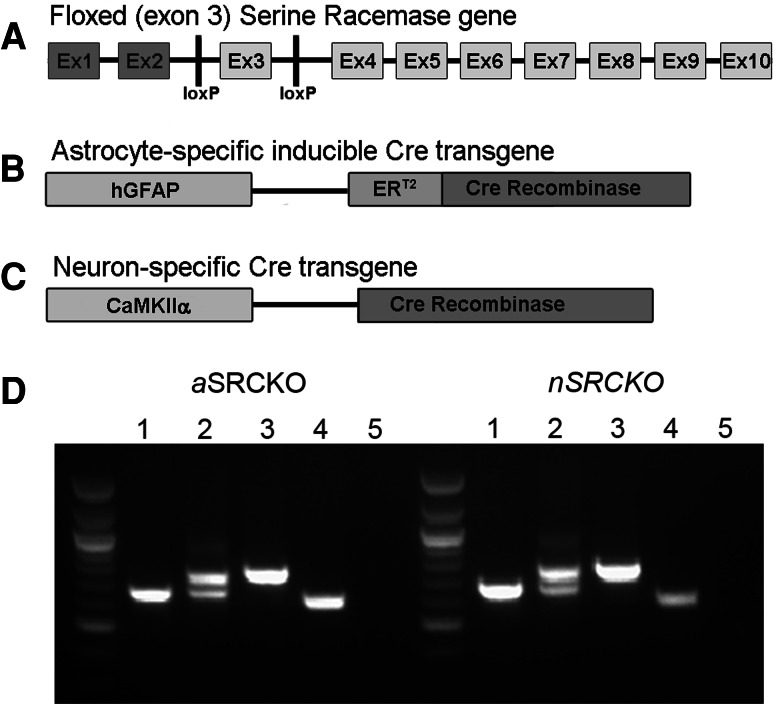
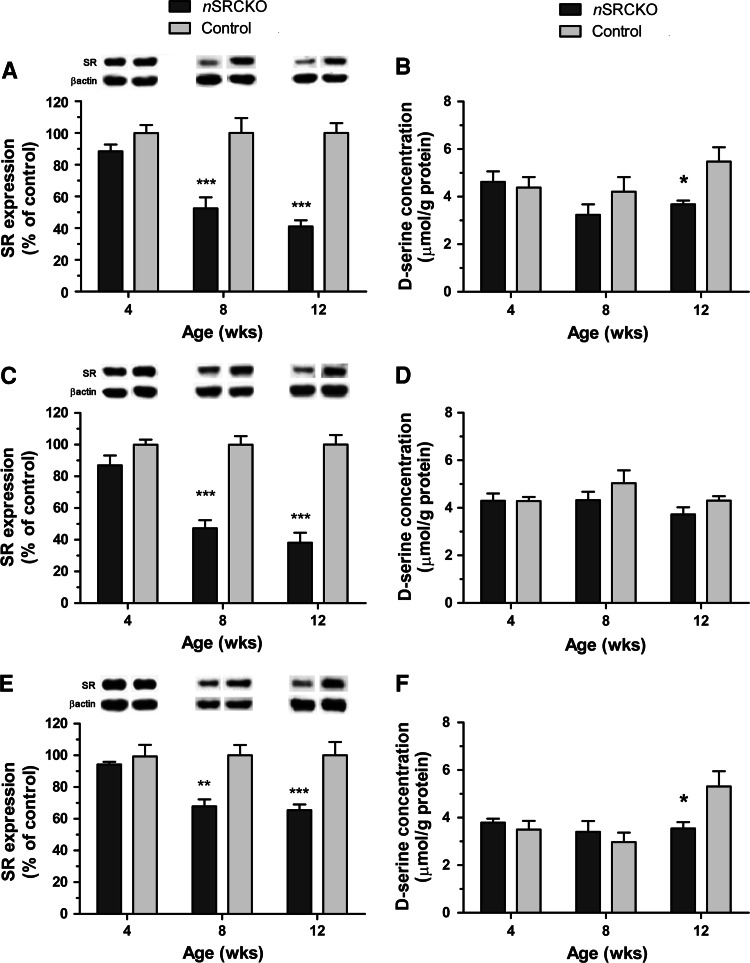
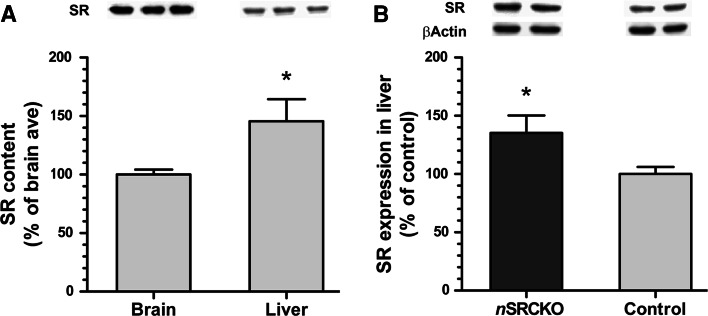
D-serine, which is synthesized by the enzyme serine racemase (SR), is a co-agonist at the N-methyl-D-aspartate receptor (NMDAR). Crucial to an understanding of the signaling functions of D-serine is defining the sites responsible for its synthesis and release. In order to quantify the contributions of astrocytes and neurons to SR and D-serine localization, we used recombinant DNA techniques to effect cell type selective suppression of SR expression in astrocytes (aSRCKO) and in forebrain glutamatergic neurons (nSRCKO). The majority of SR is expressed in neurons: SR expression was reduced by ~65% in nSRCKO cerebral cortex and hippocampus, but only ~15% in aSRCKO as quantified by western blots. In contrast, nSRCKO is associated with only modest decreases in D-serine levels as quantified by HPLC, whereas D-serine levels were unaffected in aSRCKO mice. Liver expression of SR was increased by 35% in the nSRCKO, suggesting a role for peripheral SR in the maintenance of brain D-serine. Electrophysiologic studies of long-term potentiation (LTP) at the Schaffer collateral-CA1 pyramidal neuron synapse revealed no alterations in the aSRCKO mice versus wild-type. LTP induced by a single tetanic stimulus was reduced by nearly 70% in the nSRCKO mice. Furthermore, the mini-excitatory post-synaptic currents mediated by NMDA receptors but not by AMPA receptors were significantly reduced in nSRCKO mice. Our findings indicate that in forebrain, where D-serine appears to be the endogenous co-agonist at NMDA receptors, SR is predominantly expressed in glutamatergic neurons, and co-release of glutamate and D-serine is required for optimal activation of post-synaptic NMDA receptors.


Figures

Fig. 1
Fig. 1
Genetic strategy for the creation of aSRCKO and nSRCKO. Panel a shows the “floxed” (fl) SR gene, with loxP sites having been inserted into intronic sequences flanking exon 3. Exons 1 and 2 (darkly shaded) are non-coding. Panels b and c illustrate the promoter elements (lighter shading) of the Cre recombinase transgenes that engender cell type specificity, and in the case of b, temporal control through TAM induction via the mutant estrogen receptor (ERT2). The glial fibrillary acidic protein (GFAP) promoter is selectively activated in astrocytes and the Ca2+/calmodulin-dependent kinase IIα (CaMKIIα) promoter in neurons of the forebrain. Panel d illustrates the genotyping PCR products that identify the various genotypes. For both strains: (1) SR +/+, (2) SR fl/+, (3) SR fl/fl, (4) Cre transgene positive, and (5) no Cre transgene
Fig. 2
Fig. 2
Modest reduction in total forebrain SR in aSRCKO subjects. Panel a shows a 15% reduction SR content found in the forebrain of aSRCKO subjects as compared with control (*p < 0.05, Student’s t test, n = 23–32). Data are expressed as mean percent of control (±SEM). Example immunoblot bands are shown for SR and β-actin (loading control) for each genotype. Panel b shows the results of HPLC analysis of forebrain d-serine levels. No difference was found between genotypes (n = 15). Data are expressed as mean d-serine concentration in μmol/g protein (±SEM). Panel c shows an example HPLC chromatogram. Peaks identified by amino acid standards include a l-aspartate, b l-homocysteic acid (internal standard), c l-glutamate, d l-serine, e l-glutamine and f d-serine
Fig. 3
Fig. 3
SR and d-serine in forebrain subregions of the nSRCKO are reduced to a different extent. Changes in SR expression in the frontal cortex, hippocampus and striatum are shown in panels a, c and e, respectively. All SR expression values (SR/β-actin) are presented as the percentage of the corresponding (age and brain region) control (±SEM). Significant differences are indicated (*p < 0.05, **p < 0.01, ***p < 0.001, Bonferroni-corrected post hoc t test, n = 5–6). Representative immunoblot bands are shown for each condition for SR and β-actin. Changes in d-serine tissue homogenate content in the frontal cortex, hippocampus and striatum are shown in panels b, d and f, respectively. Data are expressed as mean d-serine concentration in μmol/g protein (±SEM). Significant differences are indicated as compared with corresponding control (*p < 0.05, Bonferroni-corrected post hoc t test, n = 5–6)
Fig. 4
Fig. 4
Cellular distribution of SR expression in aSRCKO, nSRCKO and control brains. Light microscopy of SR immunoreactivity in sagittal sections from aSRCKO, control (SR fl/fl) and nSRCKO mice is shown in panels ac, respectively. Each panel is a collage of four images obtained with a ×20 objective. Images show the CA1 region of the hippocampus, corpus callosum and all layers of the parietal cortex (from image bottom to top). Panel d depicts the SR immunoreactivity of the dorsal striatum. Panels e and f are higher magnification (×40) images of control SR immunoreactivity, showing the principal cell layer of the hippocampus and layers II/III of the cortex, respectively. Panel g depicts a mouse brain atlas image (~1.56 mm lateral to midline) that corresponds to the sections shown in a, b and c with the region of analysis indicated by the highlighted rectangle
Fig. 5
Fig. 5
LTP at the Schaffer collateral–CA1 synapses in the hippocampus is suppressed in nSRCKO but not in aSRCKO mice. Panel a summary of LTP experiments at the Schaffer collateral–CA1 synapses from four control mice (n = 10 slices, black symbols) and four aSRCKO mice (n = 13 slices, red symbols). LTP was induced by one 1-s train of high-frequency stimulation (100 Hz, at arrow). Insets show the average of 10 fEPSPs recorded before (black traces) and 45 min after (gray traces) the induction of LTP in control and aSRCKO mice. Panel b summary of LTP experiments from six control mice (n = 9 slices) and six nSRCKO mice (n = 10 slices). LTP was also induced by one 1-s train of high-frequency stimulation (100 Hz, at arrow). Panel c summary of LTP experiments from five control mice (n = 8 slices) and four nSRCKO mice (n = 9 slices). Here, LTP was induced by three 1-s trains (100 Hz), delivered 20 s apart. Panel d summary of all LTP results (from a to c). Results are presented as means ± SEM. ***p < 0.001 (unpaired Student’s t test). (Color figure online)
Fig. 6
Fig. 6
Amplitude of the NMDAR mEPSCs is decreased in nSRCKO mice. Panel a, traces of mEPSCs recorded in CA1 neurons from control or nSRCKO mice at −70 mV (bottom) and +40 mV (top). Traces are averages of 50–150 mEPSCs at each holding potential before (black traces) and after (red traces) the addition of 10-μM d-serine to external solution. The AMPA receptor-mediated current was measured at the peak of the mEPSCs amplitude at −70 mV. The NMDAR-mediated component of mEPSCs at +40 mV was measured 15 ms after the peak of the AMPAR mEPSCs at −70 mV (at dashed lines). Panel b, summary plot for experiments as in a showing the averaged peak amplitude of the AMPAR mEPSCs at −70 mV (open bars) and the amplitude of the NMDAR-mediated component of the mEPSCs at +40 mV (filled bars) from four control mice (n = 13 neurons) and four nSRCKO mice (n = 10 neurons) under control conditions (black color) and in the presence of 10-μM d-serine (red color). *p < 0.05 (unpaired Student’s t test). (Color figure online)
Fig. 7
Fig. 7
SR expression in the liver increases after neuronal deletion. Panel a depicts the differences in relative SR content between the brain and liver as determined by immunoblot. Example immunoblots are shown for identical loading amounts (40 μg of protein). Average optical density was then scaled up by factoring in total organ protein content, and is expressed as a percent of brain content (±SEM). Liver contains 46% more SR than brain (*p < 0.05, Student’s t test, n = 8). Panel b illustrates the relative SR expression levels in nSRCKO and control mice. SR expression (normalized to β-actin) is expressed as a percent of control (±SEM). nSRCKO subjects display 35% greater SR expression than control (*p < 0.05, Student’s t test, n = 15)

References

    1. Asztely F, Erdemli G, Kullmann DM (1997) Extrasynaptic glutamate spillover in the hippocampus: dependence on temperature and the role of active glutamate uptake. Neuron 18:281–293 - PubMed
    1. Basu AC, Tsai GE, Ma CL, Ehmsen JT, Mustafa AK, Han L, Jiang ZI, Benneyworth MA, Froimowitz MP, Lange N, Snyder SH, Bergeron R, Coyle JT (2009) Targeted disruption of serine racemase affects glutamatergic neurotransmission and behavior. Mol Psychiatry 14:719–727 - PMC - PubMed
    1. Boehning D, Snyder SH (2003) Novel neural modulators. Annu Rev Neurosci 26:105–131 - PubMed
    1. Casper KB, Jones K, McCarthy KD (2007) Characterization of astrocyte-specific conditional knockouts. Genesis 45:292–299 - PubMed
    1. D’Aniello A, D’Onofrio G, Pischetola M, D’Aniello G, Vetere A, Petrucelli L, Fisher GH (1993) Biological role of d-amino acid oxidase and d-aspartate oxidase. Effects of d-amino acids. J Biol Chem 268:26941–26949 - PubMed

Publication types