. 2012 Apr;61(4):866-76.
doi: 10.2337/db10-1492. Epub 2012 Feb 23.

Endothelial progenitor cell cotransplantation enhances islet engraftment by rapid revascularization

Affiliations

Endothelial progenitor cell cotransplantation enhances islet engraftment by rapid revascularization

Shinae Kang et al. Diabetes. 2012 Apr.

Abstract

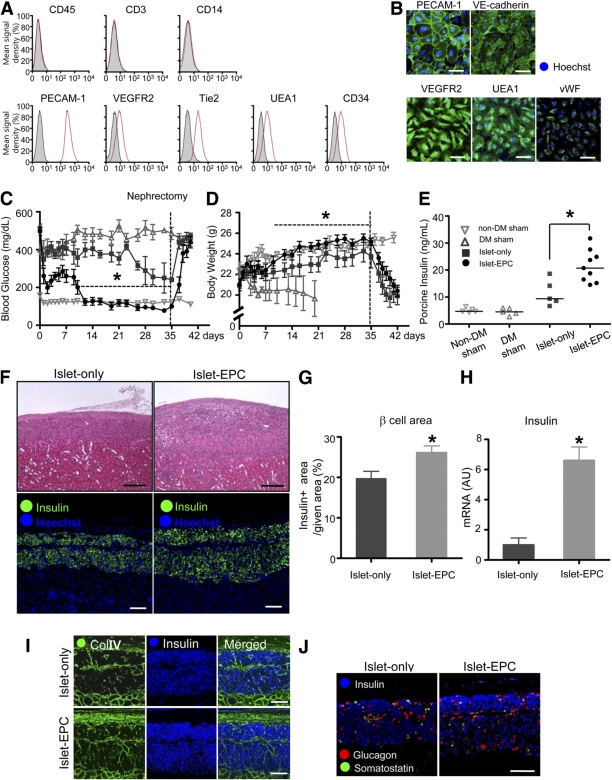
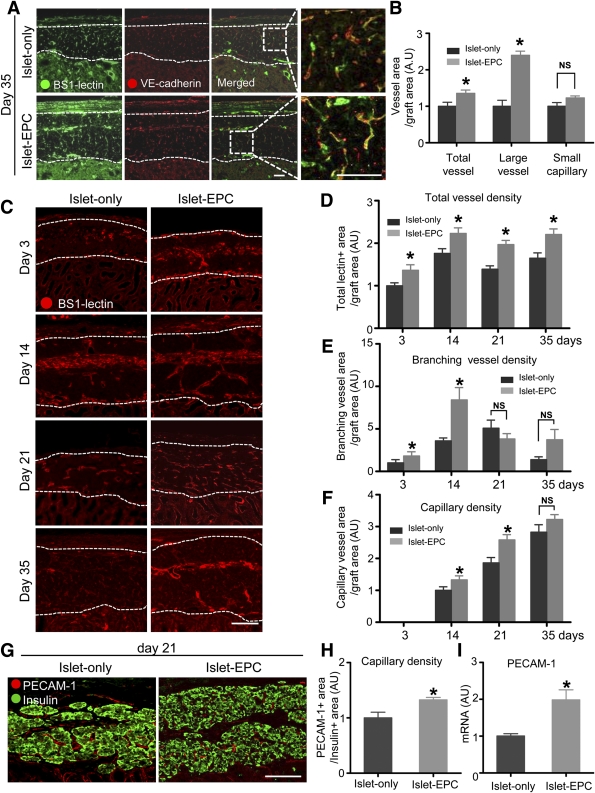
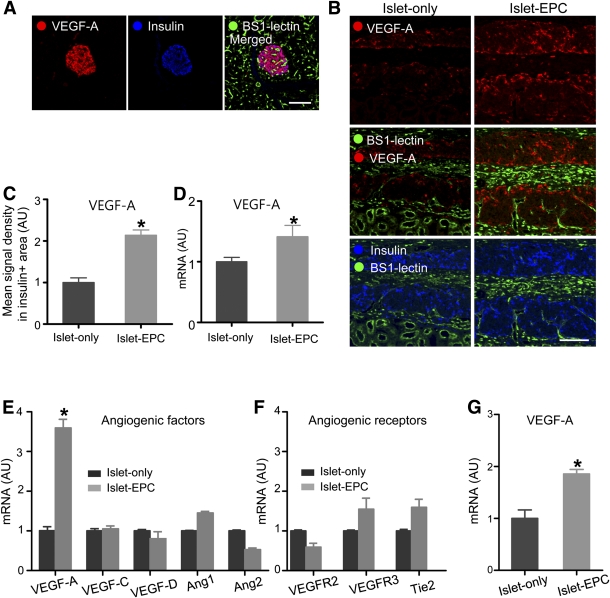
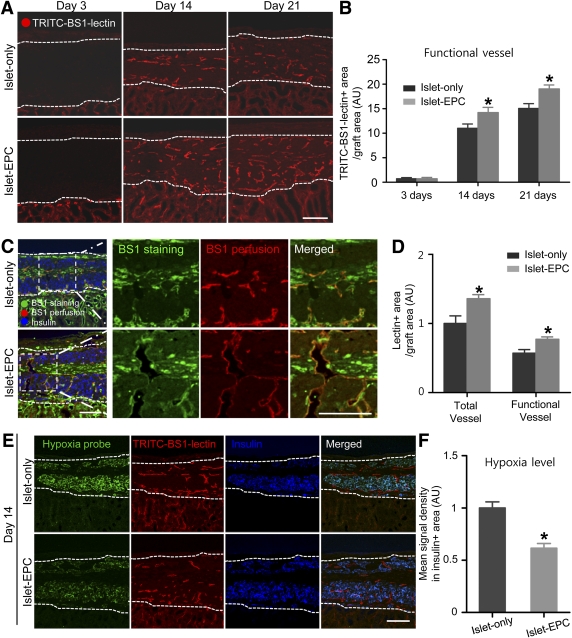
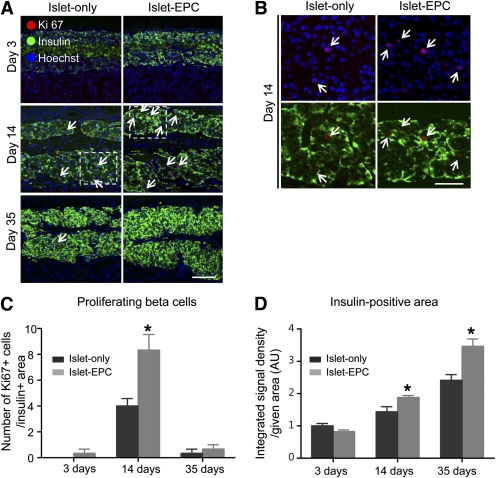
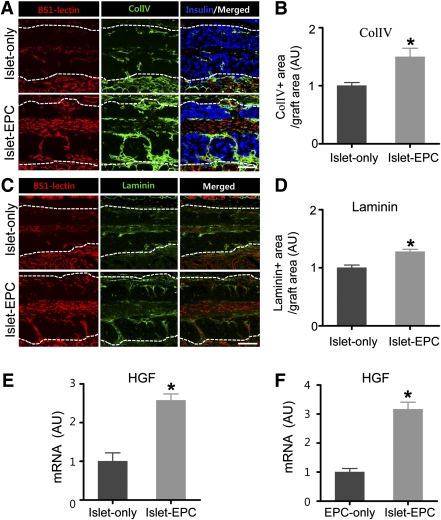
Impaired revascularization of transplanted islets is a critical problem that leads to progressive islet loss. Since endothelial progenitor cells (EPCs) are known to aid neovascularization, we aimed to enhance islet engraftment by cotransplanting EPCs with islets. Porcine islets, with (islet-EPC group) or without (islet-only group) human cord blood-derived EPCs, were transplanted into diabetic nude mice. The islet-EPC group reached euglycemia by ∼11 days posttransplantation, whereas the islet-only group did not. Also, the islet-EPC group had a higher serum porcine insulin level than the islet-only group. Islets from the islet-EPC group were more rapidly revascularized at the early period of transplantation without increment of final capillary density at the fully revascularized graft. Enhanced revascularization rate in the islet-EPC group was mainly attributed to stimulating vascular endothelial growth factor-A production from the graft. The rapid revascularization by EPC cotransplantation led to better graft perfusion and recovery from hypoxia. EPC cotransplantation was also associated with greater β-cell proliferation, probably by more basement membrane production and hepatocyte growth factor secretion. In conclusion, cotransplantation of EPCs and islets induces better islet engraftment by enhancing the rate of graft revascularization. These findings might provide a directly applicable tool to enhance the efficacy of islet transplantation in clinical practice.


Figures

FIG. 1.
FIG. 1.
Better glycemic control and islet engraftment with EPC cotransplantation. A and B: Cord blood–derived EPCs of passage 3 were harvested and analyzed for expression of EPC markers by fluorescence-activated cell sorting (A) and immunocytostaining (B). EPCs were negative for CD45, CD3, and CD14 expression and positive for PECAM-1, VEGFR2, Tie2, UEA1, CD34, VE-cadherin, and vWF expression. CE: Islets were transplanted into the kidney capsules of the recipient mice with or without EPCs (n = 6–9 per group). The blood glucose levels (C) and body weights (D) of each group were measured for 42 days after transplantation. E: The fasting serum porcine insulin level was measured with an immunoradiometric assay at day 35 (n = 5–8 per group). FJ: The graft-bearing kidney was harvested at day 35. F: The upper panel shows hematoxylin-eosin staining of the grafts in the islet-only and islet-EPC groups. The lower panel shows the insulin-positive area of each group, as determined by the immunostaining. G: The insulin-positive area was measured and presented as the percentage of a given area (0.72 mm2) (n = 4). H: The graft site of each mouse was analyzed for insulin by q-PCR with porcine-specific primers. The data are presented in arbitrary units (AU) after normalization to glyceraldehyde-3-phosphate dehydrogenase, with the islet-only group set to 1 (n = 4). I: Connective tissue area of the graft was visualized by Col IV together with insulin for β-cells by immunostaining. J: Endocrine cells of the graft were visualized for glucagon (α-cell), somatostatin (δ-cell), and insulin (β-cell) by immunostaining. Scale bars, 100 μm. All data are presented as means ± SE. *P < 0.05 vs. the islet-only group. (A high-quality color representation of this figure is available in the online issue.)
FIG. 2.
FIG. 2.
Rapid revascularization of the graft by EPC cotransplantation. A and B: The blood vessels of the graft site were visualized at day 35 using BS1-lectin and VE-cadherin immunostaining (n = 4). A: Representative images of the immunostaining. The areas in the white dotted rectangle are shown as magnification view in the right panel. B: The total area of all vessels, large-vessel (diameter ≥5 μm) and small-capillary (diameter <5 μm), in the graft were quantified. C–F: The BS1-lectin–positive blood vessels of the graft were shown from early to late time point (days 3, 14, 21, and 35). C: Representative images of the immunostaining. DF: The area of total BS1-lectin–positive vessels (D), branching vessels longer than 30 μm (E), and capillary density (F) were measured in the graft site (n = 4). All quantification data of vascular density in B, D, E, and F were calculated as percent area of the total graft area and then presented as arbitrary units (AU), with the value of the islet-only group set to 1 in B, with the value of the islet-only group at day 3 set to 1 in D and E, and with the value of the islet-only group at day 14 set to 1 in F. G and H: The capillary density of the intraislet area at day 21 was visualized with anti-human and anti-pig/mouse PECAM-1 antibodies (red) together with insulin antibody (green). G: Representative images of the PECAM-1 immunostaining. H: The capillary density positive for PECAM-1 within the insulin-positive area was measured, calculated as percent area of the insulin-positive area, and then presented as arbitrary units with the value of the islet-only group set to 1 (n = 4). I: The graft sites of each mouse at day 10 were dissected, harvested, and analyzed for PECAM-1 with primers all for human, porcine, and mouse by q-PCR (n = 4). All of the q-PCR data are presented in arbitrary units after normalization to glyceraldehyde-3-phosphate dehydrogenase, with the islet-only group set to 1. The data are presented as means ± SE. *P < 0.05 vs. the islet-only group. White dotted lines show the territory of the graft site. Scale bars, 50 μm in A and 100 μm in C and G. (A high-quality color representation of this figure is available in the online issue.)
FIG. 3.
FIG. 3.
The mechanisms underlying the EPC-induced neovascularization in islet transplantation. A: The porcine pancreas was visualized with VEGF-A, insulin, and BS1-lectin immunostaining. B and C: Graft-bearing kidneys were removed at day 14, and the VEGF-A expression was visualized together with the BS1-lectin and insulin immunostaining. B: Representative images of the graft. C: The mean VEGF-A signal density from the insulin-positive area was measured and presented in arbitrary units (AU), with the value of the islet-only group set to 1 (n = 4). D: At day 10, the graft site of each mouse was dissected, harvested, and analyzed for VEGF-A by q-PCR with porcine-specific primers. The data are presented in arbitrary units after normalization to glyceraldehyde-3-phosphate dehydrogenase, with the value for the islet-only group set to 1 (n = 4). E–G: Mouse islets (E and F) or porcine islets (G) were cultivated with human EPCs for 48 h or 4 days, respectively, and harvested for RNA extraction. Mouse and porcine islets were cultivated without EPCs under the same conditions to serve as controls. The angiogenic growth factors and their receptors were evaluated by q-PCR with mouse-specific (E and F) and porcine-specific (G) primers. The data are presented in arbitrary units after normalization to mouse-specific β-actin for the mouse islets or to porcine-specific glyceraldehyde-3-phosphate dehydrogenase for the porcine islets, with the values for the islet-only group set to 1 (n = 3). The data are presented as means ± SE. *P < 0.05 vs. the islet-only group. Scale bars, 100 μm. (A high-quality color representation of this figure is available in the online issue.)
FIG. 4.
FIG. 4.
Improvement of graft perfusion and recovery from ischemia by EPC cotransplantation. A and B: The functional blood vessels in the graft were analyzed with TRITC-BS1-lectin perfusion at days 3, 14, and 21 posttransplantation. A: Representative images of the perfused vessels in the graft site. B: The TRITC-positive vessel area in A was calculated as the percentage of the total graft area, and then the values are presented in arbitrary units (AU) with the value of the islet-only group set at day 3 to 1 (n = 4). C and D: The total blood vessels were identified with FITC-BS1-lectin staining together with functional vessels identified with TRITC-BS1-lectin perfusion at day 14. C: Representative images of functional vessels among the entire vessels are presented in the left panel. The right panels show the magnification view of the insert in the white dotted rectangle. D: TRITC-positive functional vessel area and FITC-positive total vessel area were calculated as the percentage of the total graft area, and then the values were presented in arbitrary units with the value of total vessel for the islet-only group set to 1 (n = 4). E and F: The graft ischemia was evaluated by the Hypoxyprobe-positive signal at day 14 in both groups. E: Representative images of the Hypoxyprobe-positive area in the graft are shown, together with the TRITC-BS1-lectin and insulin immunostaining. F: The mean signal density of the Hypoxyprobe from the insulin-positive area was measured and presented in arbitrary units, with the value of the islet-only group set to 1 (n = 4). The data are presented as means ± SE. *P < 0.05 vs. the islet-only group. White dotted lines show the territory of the graft site. Scale bars, 100 μm. (A high-quality color representation of this figure is available in the online issue.)
FIG. 5.
FIG. 5.
EPC cotransplantation is associated with β-cell proliferation. A–C: The transplanted islets were evaluated for proliferation by Ki67/insulin double staining at days 3, 14, and 35. A: The Ki67/insulin–double-positive proliferating β cells were visualized at each time point (arrow). Hoechst stain was used to distinguish the nucleus. B: Magnification views of the inserts within the white dotted line at day 14. C: The number of Ki67-positive cells among the insulin-positive cells in the total given area was counted (0.18 mm2) (n = 4). D: The integrated density of the insulin-positive area of the total given area (0.18 mm2) was measured and presented in arbitrary units (AU), with the value of day 3 for the islet-only group set to 1 (n = 4). The data are presented as means ± SE. *P < 0.05 vs. the islet-only group. Scale bars, 100 μm in A and 50 μm in B. (A high-quality color representation of this figure is available in the online issue.)
FIG. 6.
FIG. 6.
β-Cell proliferation in the EPC-cotransplanted group is associated with more basement protein and HGF production. A–D: At day 14, the BS1-lectin–positive blood vessels and Col IV– or laminin-positive basement membrane were visualized. The insulin was immunostained to distinguish the graft site. The representative images for Col IV (A) and laminin (C) are shown. White dotted lines show the territory of the graft site. Scale bars, 100 μm. The Col IV–positive (B) and the laminin-positive (D) areas from total graft area were calculated as a percentage of the total graft area and then presented as arbitrary units (AU), with the value of the islet-only group set to 1 (n = 4). E and F: The graft sites of day 10 from each mouse in vivo (E) and human EPCs cocultured in vitro with or without porcine islets (F) were harvested. The specimens were analyzed for HGF by q-PCR using primers that functioned for all three species (human, porcine, and mouse) in E and for human exclusively in F. The data are presented in arbitrary units after normalization to glyceraldehyde-3-phosphate dehydrogenase, with the value for the islet-only group set to 1 in E and with the value for the EPC-only group set to 1 in F (n = 4). The data are presented as means ± SE. *P < 0.05 vs. the islet-only group in B, D, and E and vs. the EPC-only group in F. (A high-quality color representation of this figure is available in the online issue.)

Similar articles

Cited by

References

    1. American Diabetes Association Standards of medical care in diabetes—2011. Diabetes Care 2011;34(Suppl 1.):S11–S61 - PMC - PubMed
    1. Robertson RP. Islet transplantation a decade later and strategies for filling a half-full glass. Diabetes 2010;59:1285–1291 - PMC - PubMed
    1. Lammert E, Cleaver O, Melton D. Induction of pancreatic differentiation by signals from blood vessels. Science 2001;294:564–567 - PubMed
    1. Cleaver O, Melton DA. Endothelial signaling during development. Nat Med 2003;9:661–668 - PubMed
    1. Nikolova G, Jabs N, Konstantinova I, et al. The vascular basement membrane: a niche for insulin gene expression and Beta cell proliferation. Dev Cell 2006;10:397–405 - PubMed

Publication types