. 2012 Jun;61(6):1444-54.
doi: 10.2337/db11-1498. Epub 2012 Feb 23.

Resveratrol attenuates obesity-associated peripheral and central inflammation and improves memory deficit in mice fed a high-fat diet

Affiliations

Resveratrol attenuates obesity-associated peripheral and central inflammation and improves memory deficit in mice fed a high-fat diet

Byeong Tak Jeon et al. Diabetes. 2012 Jun.

Abstract

Obesity-induced diabetes is associated with chronic inflammation and is considered a risk factor for neurodegeneration. We tested the hypothesis that an AMP-activated protein kinase activator, resveratrol (RES), which is known to exert potent anti-inflammatory effects, would attenuate peripheral and central inflammation and improve memory deficit in mice fed a high-fat diet (HFD). C57BL/6J mice were fed an HFD or an HFD supplemented with RES for 20 weeks. Metabolic parameters in serum were evaluated, and Western blot analysis and immunohistochemistry in peripheral organs and brain were completed. We used the Morris water maze test to study the role of RES on memory function in HFD-treated mice. RES treatment reduced hepatic steatosis, macrophage infiltration, and insulin resistance in HFD-fed mice. In the hippocampus of HFD-fed mice, the protein levels of tumor necrosis factor-α and Iba-1 expression were reduced by RES treatment. Choline acetyltransferase was increased, and the phosphorylation of tau was decreased in the hippocampus of HFD-fed mice upon RES treatment. In particular, we found that RES significantly improved memory deficit in HFD-fed mice. These findings indicate that RES reverses obesity-related peripheral and central inflammation and metabolic derangements and improves memory deficit in HFD-fed diabetic mice.


Figures
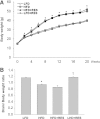
FIG. 1.
FIG. 1.
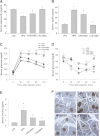
Effects of RES on whole body and brain weight in HFD-fed mice. Male C57BL/6J mice were fed an LFD, HFD, HFD+RES, or LFD+RES for 20 weeks (n = 20 per group). trans-RES was homogenously blended into the LFD or HFD, pelleted, and preserved in a manner to ensure the stability of RES. Graphs show change in body weight (A) and ratio of brain to body weight (B) for each group at time of killing (age 24 weeks). Data are mean ± SEM. *P < 0.005 for HFD- compared with LFD-fed mice. †P < 0.001 for mice fed an LFD+RES compared with HFD-fed mice.
FIG. 2.
FIG. 2.
Effects of RES on metabolic parameters in HFD-fed mice. For ELISA analysis, mice were anesthetized with zoletil (5 mg/kg) and then blood serum was extracted transcardially through the apex of the left ventricle with a 1-mL syringe. Serum adiponectin (A) and leptin (B) levels using ELISA (n = 5–7 per group). Hypoadiponectinemia and hyperleptinemia in HFD-fed mice were significantly reversed by RES treatment. C: Blood glucose levels after d-glucose (2 g/kg) injection in mice fed an LFD, HFD, HFD+RES, or LFD+RES. D: Blood glucose levels after insulin treatment (0.75 units/kg). Blood glucose levels of mice fed an HFD+RES were significantly decreased compared with HFD-fed mice. E: Serum insulin (n = 5–7 per group) levels using ELISA. RES decreased HFD-induced hyperinsulinemia. F: Representative microphotographs of immunostained insulin in pancreatic sections from mice fed an LFD, HFD, HFD+RES, or LFD+RES. Data are mean ± SEM. *P < 0.05 for HFD- compared with LFD-fed mice. †P < 0.05 for mice fed an LFD or HFD+RES compared with HFD-fed mice. Scale bar = 100 μm. (A high-quality color representation of this figure is available in the online issue.)
FIG. 3.
FIG. 3.
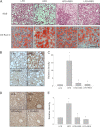
Effects of RES on hepatic steatosis, oxidative stress, and macrophage infiltration in HFD-fed mice. A: Representative microphotographs of hematoxylin and eosin (H&E)- and Oil Red O–stained liver section from mice fed an LFD, HFD, HFD+RES, or LFD+RES. B: Representative microphotographs of immunostained 4-HNE in liver sections from each group. C: Quantitative expression of 4-HNE is shown as relative density. D: Representative microphotographs of immunostained F4/80 in liver sections from each group. E: Quantitative expression of F4/80 is shown as relative density. Data are mean ± SEM. *P < 0.05 for HFD- compared with LFD-fed mice. †P < 0.05 for mice fed an LFD or HFD+RES compared with HFD-fed mice. Scale bar = 50 μm. (A high-quality digital representation of this figure is available in the online issue.)
FIG. 4.
FIG. 4.
Effects of RES on serum TNF-α and macrophage infiltration in adipose tissue in HFD-fed mice. A: Concentration of TNF-α (n = 5–7 per group) from serum of mice fed an LFD, HFD, HFD+RES, or LFD+RES using ELISA. RES significantly inhibited the HFD-induced increase of TNF-α production. B: Representative microphotographs of immunostained CD68 in epididymal fat pads from each group. CD68-expressing cells were deposited in HFD-treated adipose tissue. Arrow indicates macrophage. Scale bar = 50 μm. C: Quantitative expression of CD68 is shown as relative density. Data are mean ± SEM. *P < 0.05 for HFD- compared with LFD-fed mice. †P < 0.05 for mice fed an LFD or HFD+RES compared with HFD-fed mice. (A high-quality color representation of this figure is available in the online issue.)
FIG. 5.
FIG. 5.
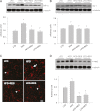
Effects of RES on neuroinflammation in the hippocampus of HFD-fed mice. A: Western blot showing hippocampal TNF-α in mice fed an LFD, HFD, HFD+RES, or LFD+RES. Quantification of hippocampal TNF-α from Western blot analysis. Densitometry values for TNF-α were normalized to α-tubulin and are represented as arbitrary units (AUs). B: Western blot showing hippocampal Iba-1 in each group of mice. Quantification of hippocampal Iba-1 from Western blot analysis. Densitometry values for Iba-1 were normalized to α-tubulin and are represented as AUs. C: Representative microphotographs of immunostained Iba-1 in CA1 region of the hippocampus from each group. Ramified microglia are present in the hippocampus of mice fed an LFD, HFD+RES, or LFD+RES, whereas activated microglia are present in HFD-fed mice. Arrow or arrowheads indicate activated microglia or ramified microglia, respectively. Scale bar = 20 μm. D: Western blot showing hippocampal 4-HNE in each group of mice. Quantification of hippocampal 4-HNE from Western blot analysis. Densitometry values for 4-HNE were normalized to α-tubulin and are represented as AUs. Data are mean ± SEM. *P < 0.05 for HFD- compared with LFD-fed mice. †P < 0.05 for mice fed an LFD or HFD+RES compared with HFD-fed mice. (A high-quality color representation of this figure is available in the online issue.)
FIG. 6.
FIG. 6.
Effects of RES on IR-mediated AMPK signaling pathway in the hippocampus of HFD-fed mice. A: Western blot showing p-IR and IR in the hippocampus of mice fed an LFD, HFD, HFD+RES, or LFD+RES. Densitometry values of p-IR were normalized to IR and represented as arbitrary units (AUs). B: Western blot showing adiponectin in the hippocampus. Densitometry values of adiponectin were normalized to α-tubulin and represented as AUs. Western blot showing phosphorylation of AMPK (C), ACC (D), GSK-3β (E), and tau (F) in the hippocampus from each group. Quantification of the phosphorylation of each protein from Western blot analysis. Densitometry values for each p-protein were normalized to total protein and are represented as AUs. Data are mean ± SEM. *P < 0.05 for HFD- compared with LFD-fed mice. †P < 0.05 for mice fed an LFD or HFD+RES compared with HFD-fed mice. G: Proposed model of the phosphorylated regulation of IR-mediated AMPK signaling pathway in the hippocampus. (A high-quality color representation of this figure is available in the online issue.)
FIG. 7.
FIG. 7.
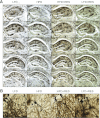
Effects of RES on neurodegeneration in the hippocampus of HFD-fed mice. A: Representative microphotographs of Golgi-stained hippocampus of mice fed an LFD, HFD, HFD+RES, or LFD+RES. Golgi-stained neurons were visualized in the hippocampal regions from bregma −1.22 to −2.54 mm of the mouse brain atlas. B: Representative, higher resolution microphotographs of Golgi-stained neurons in the hippocampus of mice fed an LFD, HFD, HFD+RES, or LFD+RES. Arrowhead and arrow indicate neuronal soma and dendrite, respectively. Scale bar = 200 μm (A) and 50 μm (B). (A high-quality digital representation of this figure is available in the online issue.)
FIG. 8.
FIG. 8.
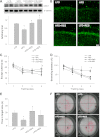
Effects of RES on hippocampal ChAT expression and memory deficits in HFD-fed mice. A: Western blot showing ChAT in the hippocampus. Densitometry values of adiponectin were normalized to α-tubulin and represented as arbitrary units. B: Representative microphotographs of immunostained ChAT in CA1 region of the hippocampus from each group. Scale bar = 50 μm. Escape latency (C) and swimming distance (D) (mean of four trials per day) in the Morris water maze (n = 10 per group) at 24 weeks. E: Comparison of time spent in the target quadrant (where the platform was located during hidden-platform training) after removing the exact location of the platform on day 5. Data are mean ± SEM. *P < 0.05 for HFD- compared with LFD-fed mice. †P < 0.05 for mice fed an LFD or HFD+RES compared with HFD-fed mice. F: Representative swim paths in the trial without the platform (probe) in each group. Note that only HFD-fed mice showed a random search pattern, whereas the other groups focused their search around the previous platform location. (A high-quality digital representation of this figure is available in the online issue.)

References

    1. Muhammad S, Bierhaus A, Schwaninger M. Reactive oxygen species in diabetes-induced vascular damage, stroke, and Alzheimer’s disease. J Alzheimers Dis 2009;16:775–785 - PubMed
    1. Akomolafe A, Beiser A, Meigs JB, et al. Diabetes mellitus and risk of developing Alzheimer disease: results from the Framingham Study. Arch Neurol 2006;63:1551–1555 - PubMed
    1. Hotamisligil GS, Shargill NS, Spiegelman BM. Adipose expression of tumor necrosis factor-alpha: direct role in obesity-linked insulin resistance. Science 1993;259:87–91 - PubMed
    1. Xu H, Barnes GT, Yang Q, et al. Chronic inflammation in fat plays a crucial role in the development of obesity-related insulin resistance. J Clin Invest 2003;112:1821–1830 - PMC - PubMed
    1. Weisberg SP, McCann D, Desai M, Rosenbaum M, Leibel RL, Ferrante AW., Jr Obesity is associated with macrophage accumulation in adipose tissue. J Clin Invest 2003;112:1796–1808 - PMC - PubMed

Publication types

MeSH terms