. 2013 Jan;218(1):187-208.
doi: 10.1007/s00429-012-0393-6. Epub 2012 Feb 24.

Common and distinct neural inputs to the medial central nucleus of the amygdala and anterior ventrolateral bed nucleus of stria terminalis in rats

Affiliations

Common and distinct neural inputs to the medial central nucleus of the amygdala and anterior ventrolateral bed nucleus of stria terminalis in rats

Michael S Bienkowski et al. Brain Struct Funct. 2013 Jan.

Abstract

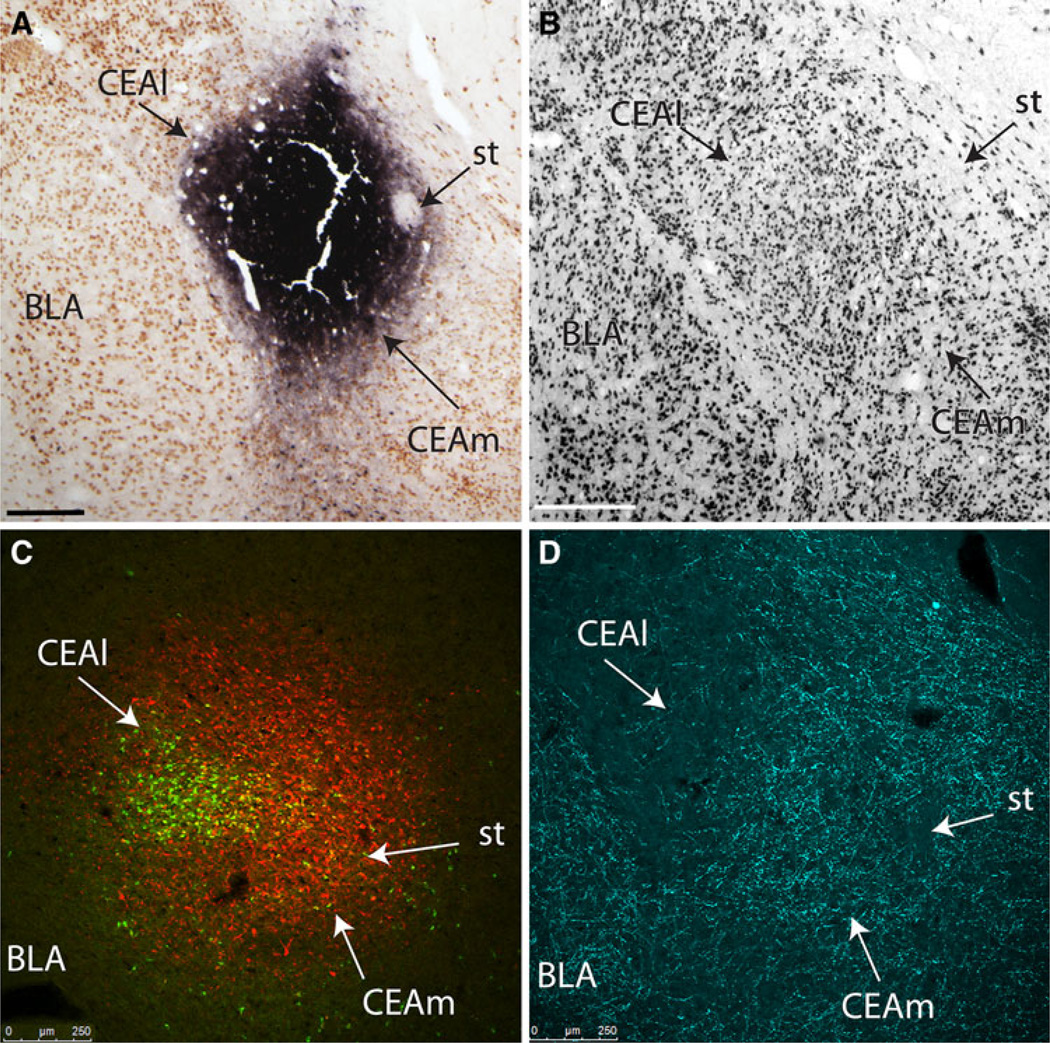
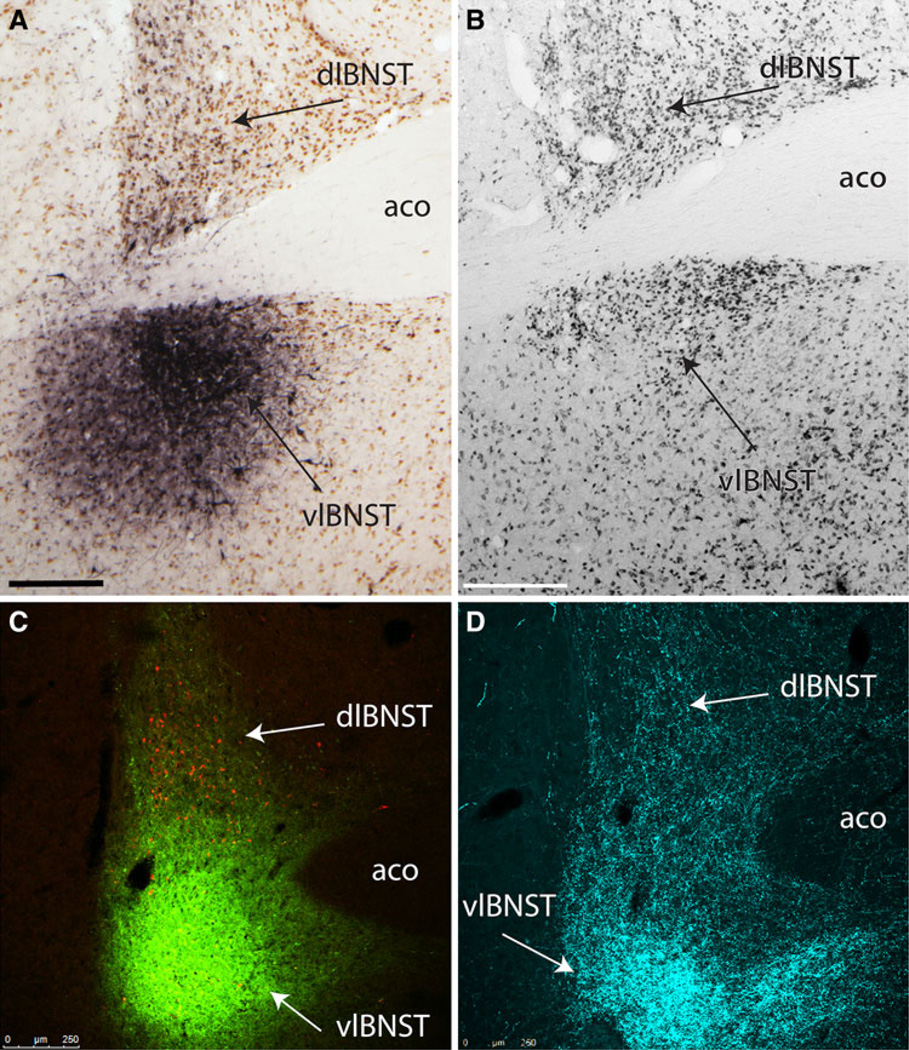
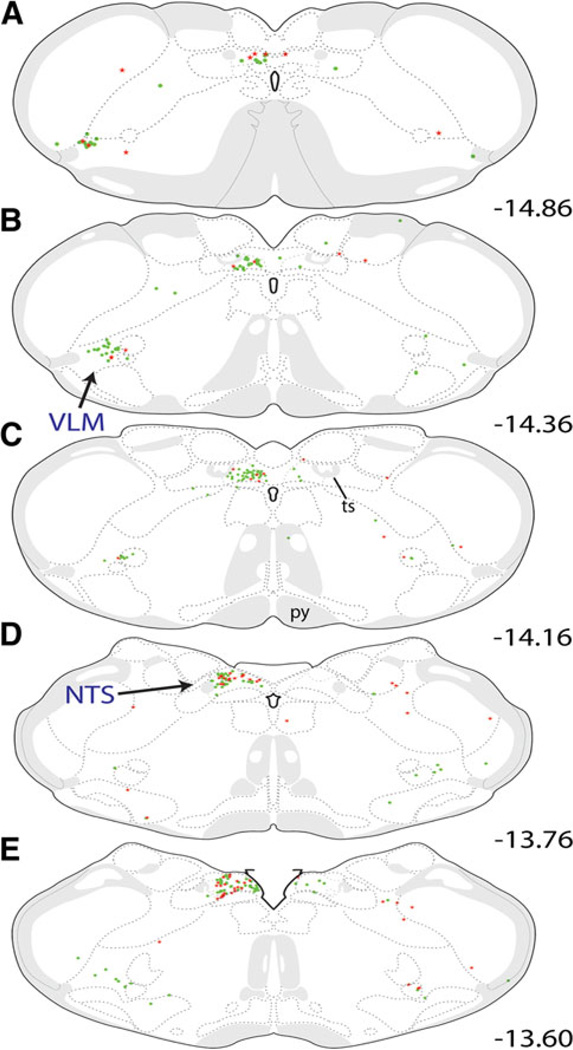
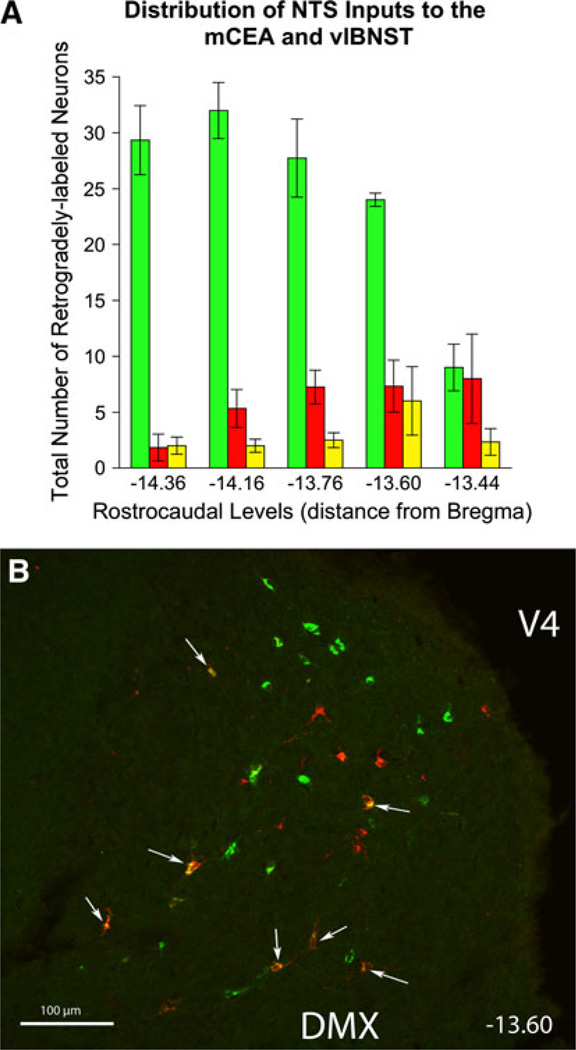
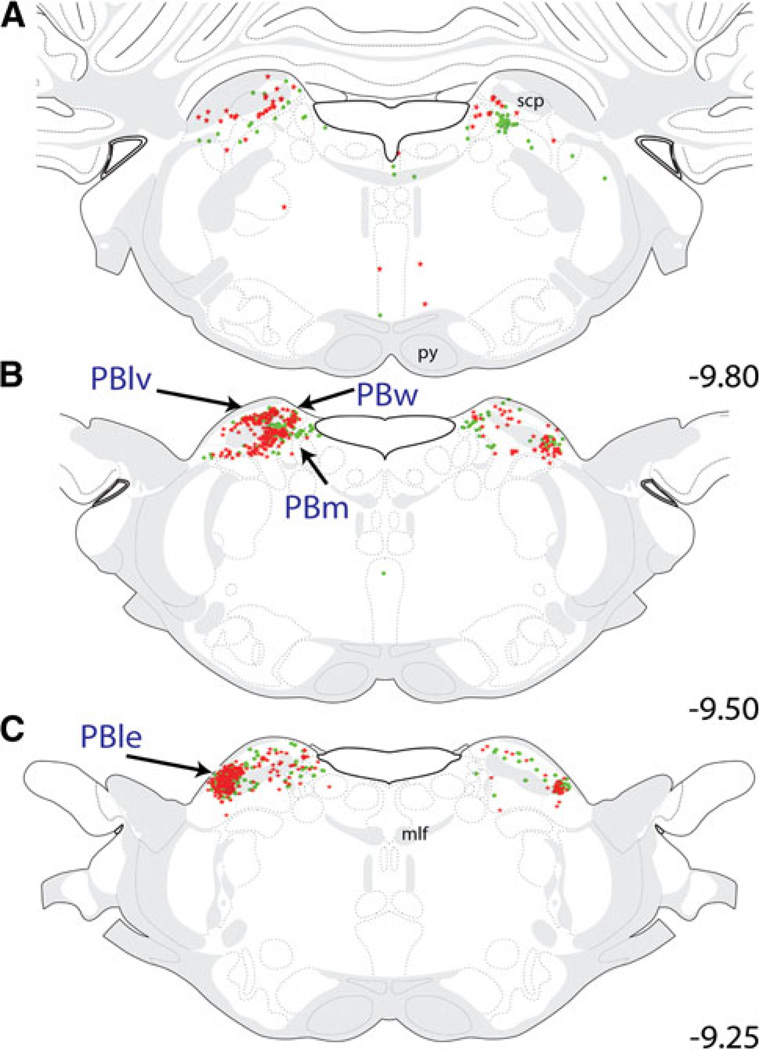
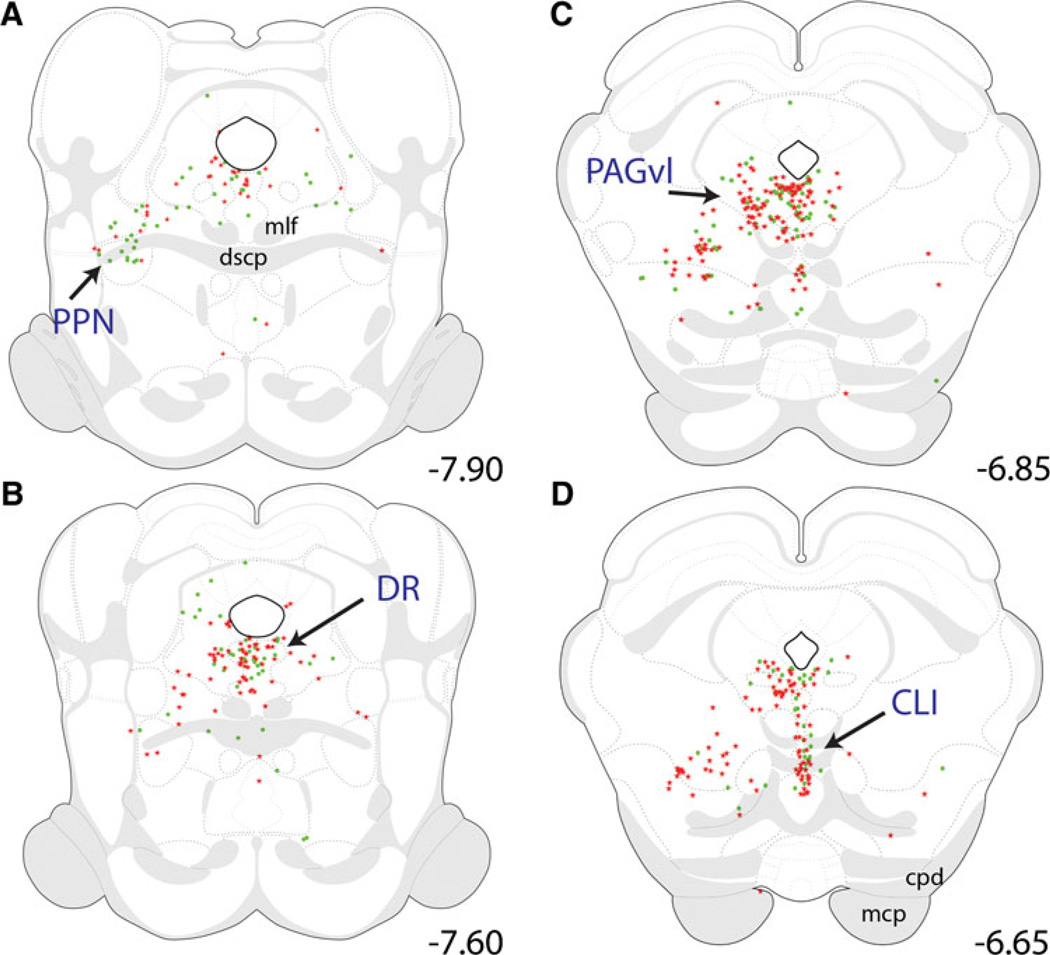
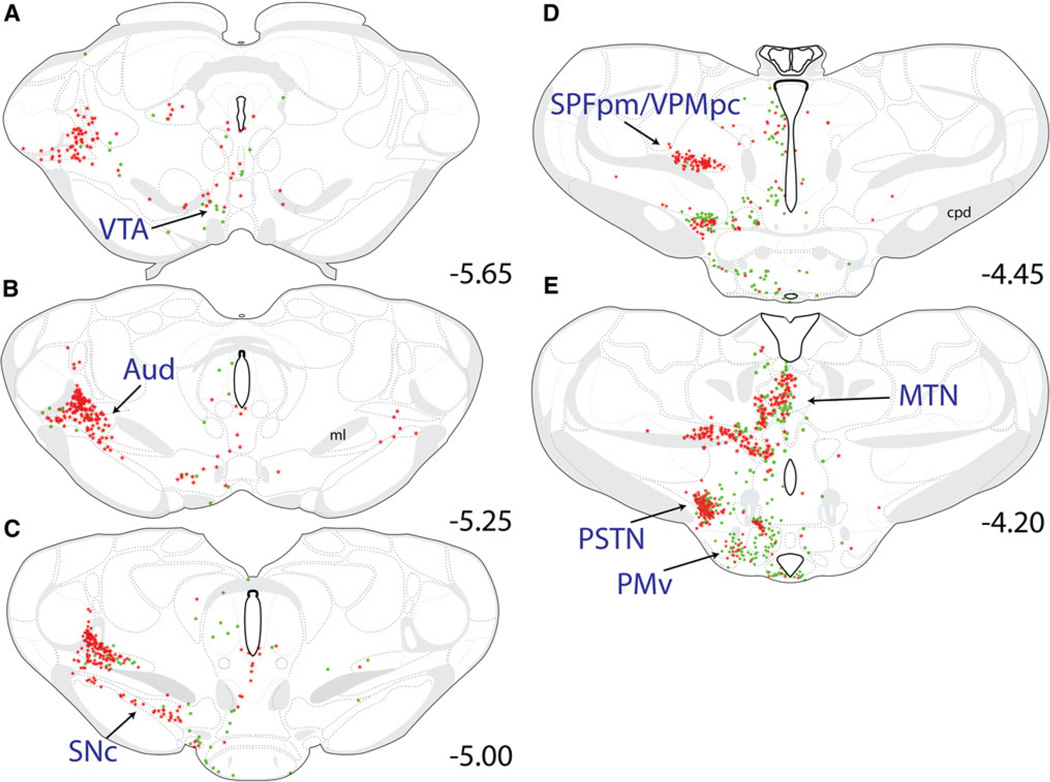
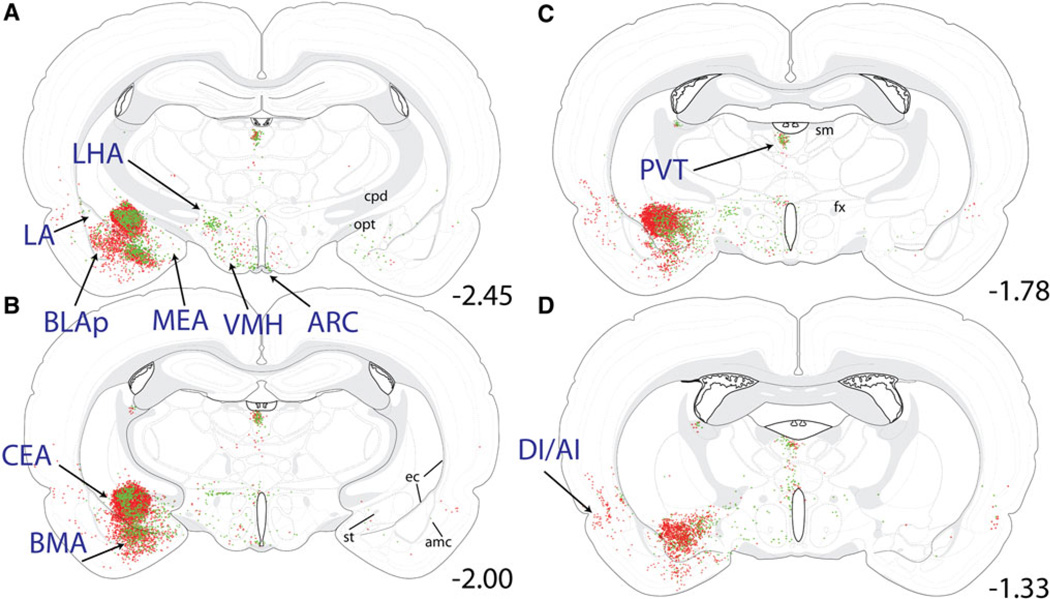
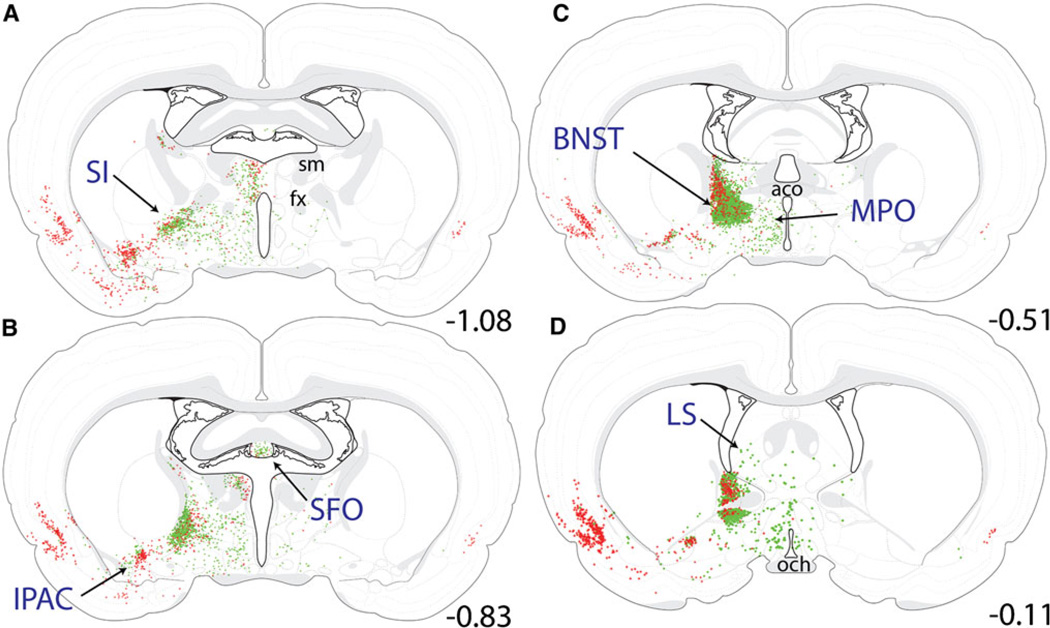
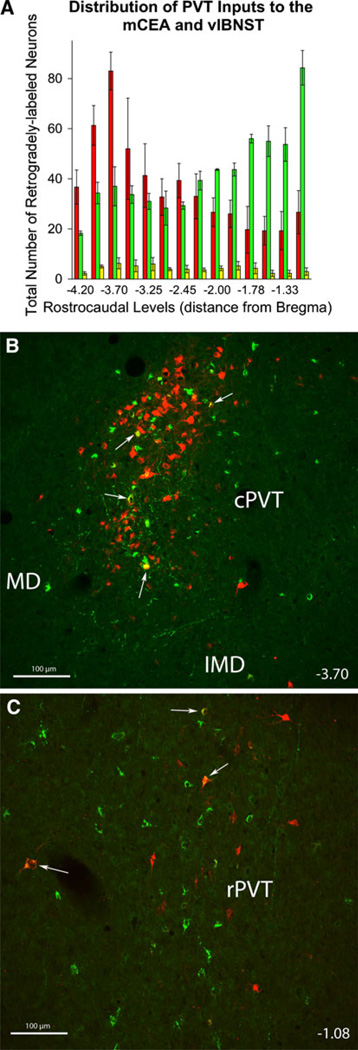
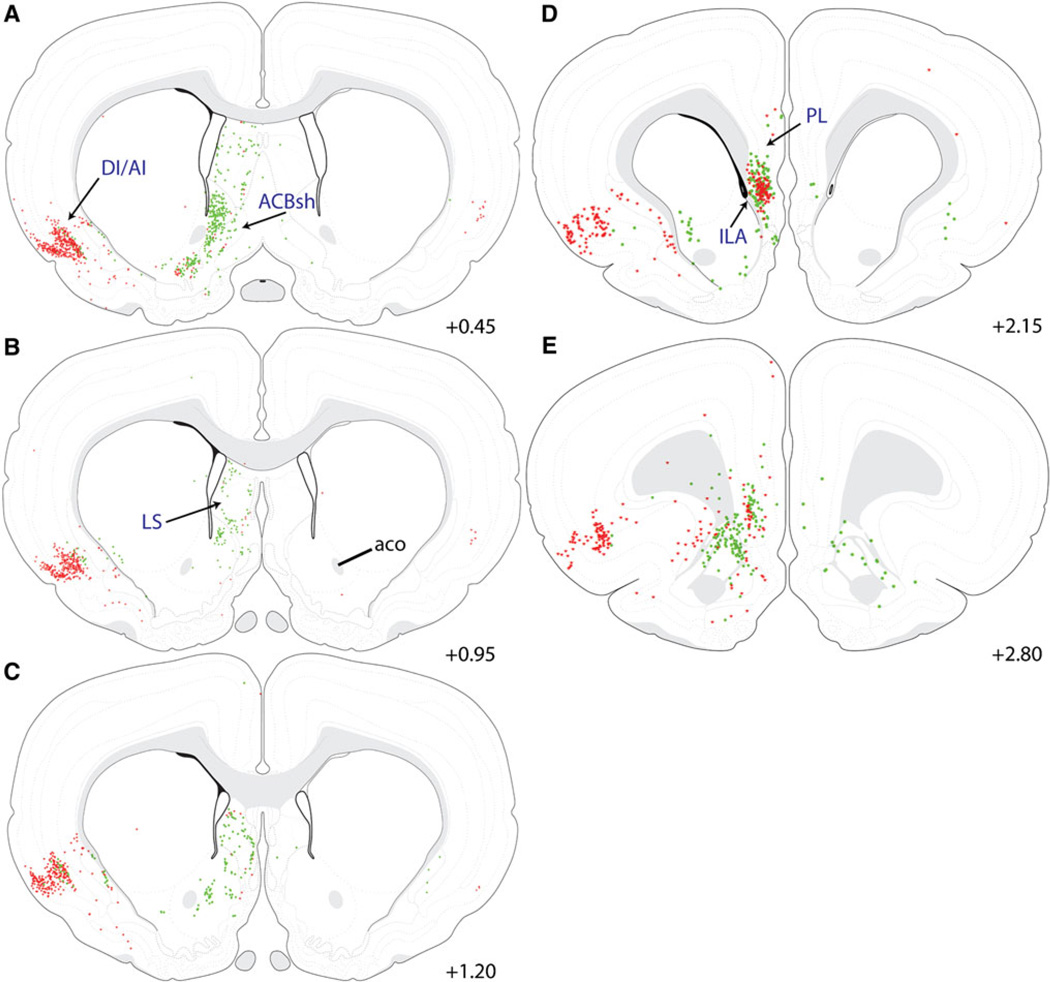
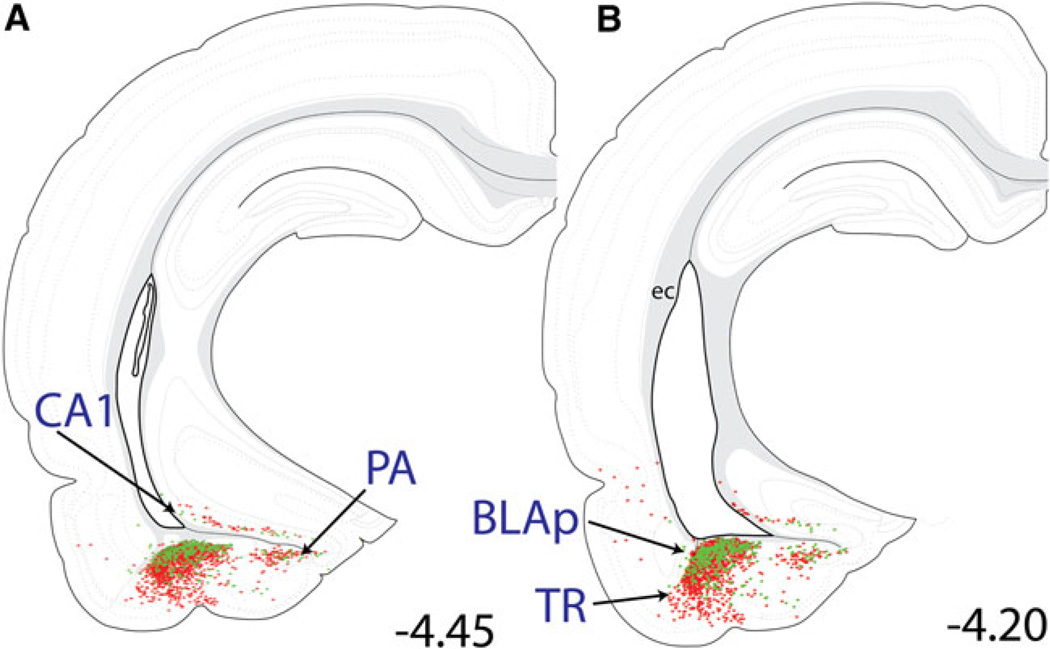
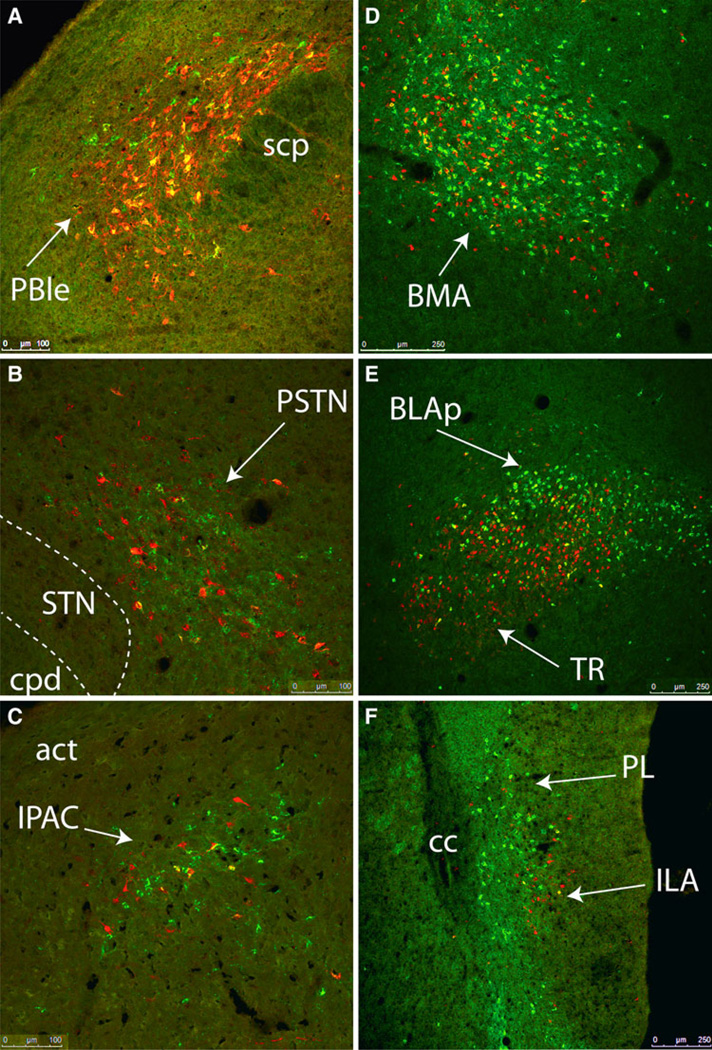
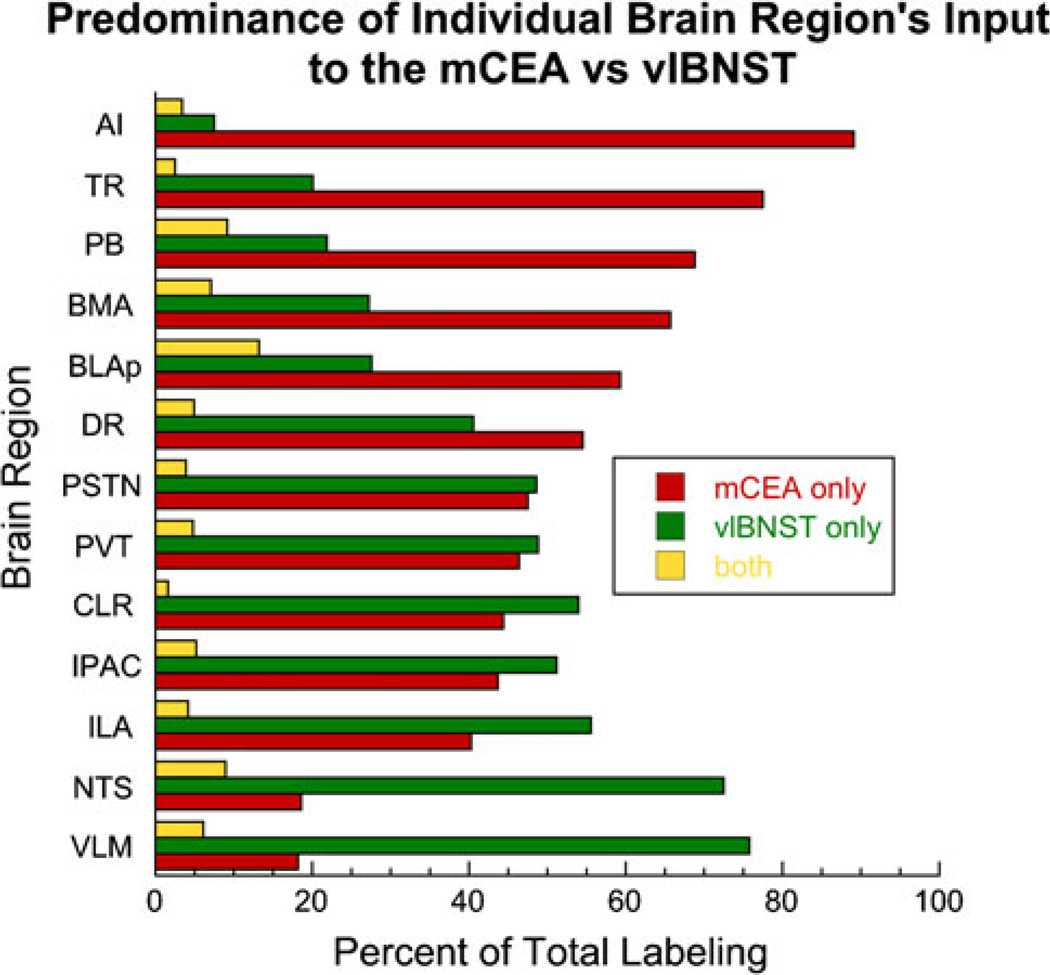
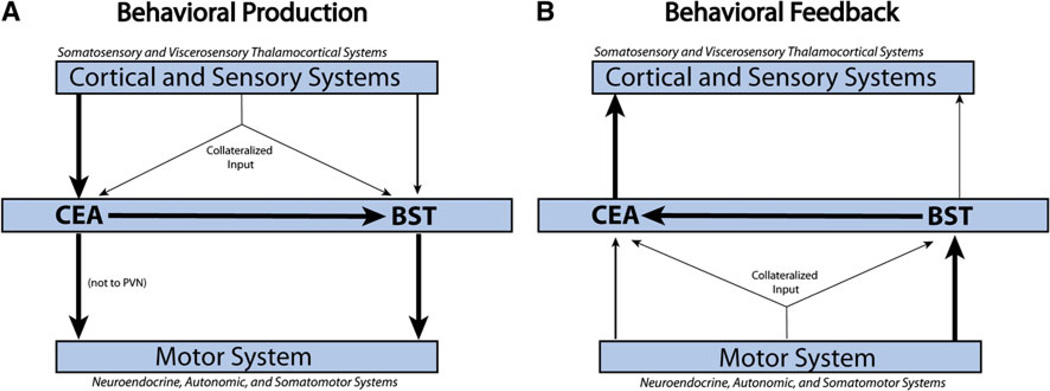
The central nucleus of the amygdala (CEA) and lateral bed nucleus of stria terminalis (BST) are highly interconnected limbic forebrain regions that share similar connectivity with other brain regions that coordinate behavioral and physiological responses to internal and environmental stressors. Their similar connectivity is frequently referred to when describing the CEA and lateral BST together as a unified "central extended amygdala". However, the CEA and BST reportedly play distinct roles in behavioral and physiological responses associated with fear, anxiety, and social defeat, presumably due to differences in connectivity. To identify common and unique sources of input to the CEA and lateral BST, we performed dual retrograde tracing. Fluorogold and cholera toxin β were iontophoresed into the medial CEA (CEAm) and the anterior ventrolateral BST (BSTvl) of adult male rats. The anatomical distribution of tracer-labeled neurons was mapped throughout the brain. Regions with overlapping populations of CEAm- and BSTvl-projecting neurons were further examined for the presence of double-labeled neurons. Although most regions with input to the mCEA also projected to the BSTvl, and vice versa, cortical and sensory system-related regions projected more robustly to the CEAm, while motor system-related regions primarily innervated the BSTvl. The incidence of double-labeled neurons with collateralized axonal inputs to the CEAm and BSTvl was relatively small (~2 to 13%) and varied across regions, suggesting regional differences in the degree of coordinated CEAm and BSTvl input. The demonstrated similarities and differences in inputs to CEAm and BSTvl provide new anatomical insights into the functional organization of these limbic forebrain regions.


Figures

Fig. 1
Fig. 1
Iontophoresis of FG or CTB retrograde tracer into the CEAm. Medial is to the right. a In case 10-9, CTB iontophoresis produced a highly localized, dense tracer deposit centered within the CEAm, although robust additional retrograde labeling also is present within the CEAl (CTB immunoperoxidase labeling is black, NeuN immunoperoxidase labeling is brown). b NeuN immunoperoxidase labeling reveals distinct cytoarchitectural boundaries of the CEA and its subnuclei (similar rostrocaudal level as in panel a). c In case 09-110, FG iontophoresis produced a spherical tracer delivery site centered within the CEAm (red immunofluorescence), although a larger sphere of tracer diffusion is seen to extend into the CEAl, where retrogradely labeled BST-projecting neurons (green) are clustered. d DBH immunofluorescently labeled fibers (cyan) are moderately dense within the CEAm, but much more sparse within the CEAl (similar rostrocaudal level as in panel c, slightly more rostral to the levels shown in panels a and b). Scale bars 250 µm
Fig. 2
Fig. 2
Iontophoresis of FG or CTB retrograde tracer into the BSTvl. Medial is to the right. a In case 10-9, FG iontophoresis produced a spherical deposit centered close to the lateral border of the BSTvl (FG immunoperoxidase labeling is black, NeuN immunoperoxidase labeling is brown). b NeuN immunoperoxidase labeling reveals distinct cytoarchitectural boundaries of the BST and its subnuclei (note the fusiform subnucleus is more lightly NeuN-positive compared to other BST subnuclei; similar rostrocaudal level to that shown in panel a). c In case 09-110, CTB iontophoresis produced a dense tracer deposit (green immunofluorescence) in the BSTvl, overlapping with FG-positive CEAm-projecting neurons (yellow). Additional FG-positive neurons are present within the BSTdl (red). d DBH immunofluorescently labeled fibers (cyan) form a dense terminal field within the BSTvl, with more moderate labeling observed within the BSTdl (similar rostrocaudal level to that shown in panel c). Scale bars 250 µm
Fig. 3
Fig. 3
Distribution maps of retrogradely labeled neurons within the caudal medulla. CEAm- and BSTvl-projecting neurons were located throughout the caudal NTS and VLM, but were most prevalent between bregma levels −14.86 and −13.60 (a–e). The number of BSTvl-projecting NTS neurons (green circles) peaked at the mid-AP level (c; bregma level −14.16) while CEAm-projecting NTS neurons (red stars) were most prevalent at a slightly more rostral level (e; see Fig. 4 for rostrocaudal quantitative data). Within the VLM, the distribution of BSTvl-projecting neurons did not appear to differ across rostrocaudal levels. CEAm-projecting VLM neurons were relatively scarce whereas BSTvl-projecting VLM neurons were more common. See Table 1 for quantification of overall NTS and VLM retrograde labeling and the incidence of double-labeled neurons with collateralized projections to both regions
Fig. 4
Fig. 4
Rostrocaudal distribution of retrogradely labeled NTS neurons. a The number of BSTvl-projecting neurons (green) peaked at the mid-AP section level (−14.16 mm from bregma), while smaller numbers of CEAm-projecting neurons (red) were distributed somewhat more rostrally, similar to the peak distribution of double-labeled neurons (yellow). b Confocal z-stack image of the retrograde labeling within the NTS in case 09-133 (bregma level −13.60, see Fig. 3e). FG-positive CEAm-projecting neurons are red; CTB-positive BSTvl-projecting neurons are green. White arrows point out several double-labeled neurons whose axons project to both the CEAm and BSTvl. Scale bars 250 µm
Fig. 5
Fig. 5
Distribution maps of retrogradely labeled pontine neurons, which were primarily located in the PB between bregma levels −9.80 and −9.25. Generally, CEAm-projecting PB neurons (red stars) were more prevalent than BSTvl-projecting PB neurons (green circles). At caudal levels (a and b), the majority of retrograde labeling was observed in the PBlv, PBw, and PBm. At more rostral levels (c), large numbers of retrogradely labeled neurons were located bilaterally within the PBle. See Table 1 for quantification of overall PB subnuclear retrograde labeling and the incidence of double-labeled neurons with collateralized projections to both the CEAm and BSTvl
Fig. 6
Fig. 6
Distribution maps of retrogradely labeled neurons within the caudal midbrain. Retrogradely labeled neurons were located within the PPN, DR, PAGvl, and CLI from bregma levels −7.90 to −6.65. a Within the PPN, most retrogradely labeled neurons were BSTvl-projecting (green circles) preferentially located near the rostral end of the PPN. At more rostral levels (b and c), large numbers of retrogradely labeled neurons occupied the region just ventral to the cerebral aqueduct, which includes the DR along the midline and the PAGvl more laterally. Further rostral (d), retrograde labeling extended ventrally along the midline to include neurons within the CLI. Within the DR and CLI, similar numbers of neurons were CEAm-projecting (red stars) and BSTvl-projecting. See Table 1 for quantification of overall PB retrograde labeling within the DR and CLI, and the incidence of double-labeled neurons with collateralized projections to both the CEAm and BSTvl
Fig. 7
Fig. 7
Distribution maps of retrogradely labeled neurons within the rostral midbrain/caudal forebrain. a–c Retrogradely labeled rostral midbrain neurons were located primarily within the SNc and VTA between bregma levels −5.65 and −5.00. Both CEAm-projecting (red stars) and BSTvl-projecting neurons (green circles) were scattered within the VTA (a and b), while only CEAm-projecting neurons were located within the SNc (c). Within the caudal thalamus (a–e), dense clusters of CEAm-projecting neurons were observed within the Aud (a–c), the SPFpm/VPMpc (d), and the MTN (e), with relatively fewer BSTvl-projecting neurons in each region. Within the caudal hypothalamus (c–e), retrogradely labeled neurons were located within the PSTN and PMv. The PMv contained predominantly BSTvl-projecting neurons and fewer CEAm-projecting neurons, whereas the PSTN contained similar numbers of BSTvl- and CEAm-projecting neurons. See Table 1 for quantification of overall PSTN retrograde labeling, and the incidence of double-labeled neurons with collateralized projections to both the CEAm and BSTvl
Fig. 8
Fig. 8
Distribution maps of retrogradely labeled forebrain neurons at the level of the tuberal hypothalamus. Retrogradely labeled neurons were located primarily within the CEA, BMA, and BLAp of the amygdala; within the LHA, VMH, and ARC of the hypothalamus; within the PVT of the thalamus; and within the DI/AI region of the cortex. The iontophoretic FG delivery site within the CEA (a–c) labeled large numbers of CEAm-projecting neurons (red stars) whose distribution within the BMA and BLAp overlapped with many BSTvl-projecting neurons (green circles; more caudal sections through the BLAp are shown in Fig. 10). Few retrogradely labeled neurons were located within the la or MEA (a). Within the hypothalamus, BSTvl-projecting neurons were prevalent within the LHA, VMH, and ARC, which contained fewer CEAm-projecting neurons (a–d). Retrogradely labeled thalamic neurons were clustered within the PVT, with smaller numbers of retrogradely labeled neurons scattered ventrally along the midline (a–d; additional retrograde labeling within the more rostral PVT is shown in Fig. 8). The cortical DI/AI contained large numbers of CEAm-projecting neurons and fewer BSTvl-projecting neurons (a–d; additional retrograde labeling within AI/DI is shown in Figs. 8, 9). See Table 1 for quantification of overall AI, PVT, BLAp, and BMA retrograde labeling, and the incidence of double-labeled neurons within each region having collateralized projections to both the CEAm and BSTvl
Fig. 9
Fig. 9
Distribution maps of retrogradely labeled forebrain neurons at the level of the preoptic hypothalamus. Retrogradely labeled neurons were located within the SI, IPAC, BST, SFO, and LS of the basal forebrain; the MPO of the hypothalamus, and the DI/AI region of the cortex. Iontophoretic CTB delivery produced a spherical deposit centered within the BSTvl that retrogradely labeled many neurons within the BSTdl (c, d). CEAm-projecting (red stars) and BSTvl-projecting neurons (green circles) were scattered throughout the SI, but formed a dense cluster within the IPAC (a–d). The SFO (b), MPO (a–d), and LS (d) contained many BSTvl-projecting neurons and fewer CEAm-projecting neurons (retrograde labeling within the more rostral LS is shown in Fig. 9). See Table 1 for quantification of overall AI and IPAC retrograde labeling, and the incidence of double-labeled neurons within each region having collateralized projections to both the CEAm and BSTvl
Fig. 10
Fig. 10
Rostrocaudal distribution of retrogradely labeled neurons within the PVT. a larger numbers of CEAm-projecting neurons (red) were located within the cPVT (−4.20 to −3.50), while larger numbers of BSTvl-projecting neurons (green) were located within the rPVT (−1.90 to −1.08). Similar numbers of CEAm- and BSTvl-projecting neurons were present in the mPVT (−3.25 to −2.00). Double-labeled neurons with collateralized axonal projections to both the CEAm and BSTvl (yellow) were distributed relatively evenly across rostrocaudal levels (see also Table 1). b Confocal z-stack image image of retrogradely labeled neurons within the cPVT in case 09-133 (bregma level −3.70). FG-positive CEAm-projecting neurons (red) were significantly more prevalent than CTB-positive BSTvl-projecting neurons (green) within the cPVT (b). Double-labeled neurons are identified by white arrows. c Confocal z-stack image of retrogradely labeled neurons within the rPVT in the same case (09-133; bregma level −1.08). CTB-positive BSTvl-projecting neurons (green) were significantly more prevalent than FG-positive CEAm-projecting neurons (red) within the rPVT. Double-labeled neurons are identified by white arrows. Scale bars for b and c = 200 µm
Fig. 11
Fig. 11
Distribution maps of retrogradely labeled neurons within the rostral forebrain. Retrograde labeling within the basal forebrain was located primarily within the ACBsh and LS, and cortical labeling was located within DI/AI and Ila. The ACBsh and LS contained primarily BSTvl-projecting neurons (green circles), while the DI/AI contained predominantly CEAm-projecting neurons (red stars). Large numbers of both CEAm- and BSTvl-projecting neurons were located within the Ila of the medial prefrontal cortex, whereas retrograde labeling within PL was much more sparse (d). See Table 1 for quantification of overall AI and Ila retrograde labeling, and the incidence of double-labeled neurons within each region having collateralized projections to both the CEAm and BSTvl
Fig. 12
Fig. 12
Distribution maps of retrogradely labeled neurons within the temporal cortex/posterior amygdala. large numbers of retrogradely labeled neurons were present within the BLAp and PA of the amygdala, TR of the cortex, and CA1 region of the ventral hippocampus. large numbers of CEAm-projecting neurons (red stars) were located within both the BLAp and TR, while the BLAp contained predominantly BSTvl-projecting neurons (green circles). Smaller numbers of CEAm- and BSTvl-projecting neurons were present within the PA and CA1 region. See Table 1 for quantification of overall BLAp retrograde labeling, and the incidence of double-labeled BLAp neurons with collateralized projections to both the CEAm and BSTvl
Fig. 13
Fig. 13
Confocal z-stack images of selected brain regions containing large numbers of CEAm- and BSTvl-projecting neurons and a relatively high incidence of double-labeling: PBle (a, compare to Fig. 5c), BMA (d, compare to Fig. 8b), and BLAp (e, compare to Fig. 12b). Conversely, despite the presence of large numbers of retrogradely labeled neurons projecting to the CEAm or BSTvl, relatively few double-labeled neurons were observed within the PSTN (b, compare to Fig. 7e), IPAC (c, compare to Fig. 9b), or Ila (f, compare to Fig. 11d). See Table 1 for quantitative data. Scale bars 100 µm in a–c, 250 µm for d–f
Fig. 14
Fig. 14
Schematic representation of the relative incidence of single-and double-tracer-labeled neurons across brain regions projecting to the CEAm and BSTvl. All regions in which labeling was quantified projected to both the CEAm and BSTvl, although each region contributed varying degrees of input to the CEAm versus the BSTvl. The proportion of double-labeled neurons projecting to both the CEAm and BSTvl was generally similar across brain regions
Fig. 15
Fig. 15
Structural anatomical model for information processing via CEA and BST circuits, based on published literature and results from the present study [schematic inspired by (Dong et al. 2001a)]. a Cortical and sensory (i.e., thalamic) regions project predominantly to the CEA, with less robust direct input to the lateral BST. The CEA can directly or indirectly (via the BST) send information to hypothalamic and brainstem motor systems that generate neuroendocrine, autonomic, and somatomotor behavioral responses. b Interoceptive feedback from motor systems regarding executed neuroendocrine, autonomic, and somatomotor outflow is received primarily by the lateral BST, with additional direct and relayed feedback to the CEA. The CEA is proposed to relay this feedback to the cortex and sensory thalamus. Thus, the CEA and BST are proposed to serve as an interface between cortical and motor systems. Bifurcating arrows represent collateralized projections from individual neurons that target both the CEA and BST, although these were minor compared to separate direct projections

References

    1. Alheid G, Heimer L. New perspectives in basal forebrain organization of special relevance for neuropsychiatric disorders: the striatopallidal, amygdaloid, and corticopetal components of substantia innominata. Neuroscience. 1988;1:1–39. - PubMed
    1. Altschuler SM, Bao X, Bieger D, Hopkins DA, Miselis RR. Viscerotopic representation of the upper alimentary tract in the rat: sensory ganglia and nuclei of the solitary and spinal trigeminal tracts. J Comp Neurol. 1989;283(2):248–268. - PubMed
    1. Bhatnagar S, Dallman M. Neuroanatomical basis for facilitation of hypothalamic-pituitary-adrenal responses to a novel stressor after chronic stress. Neuroscience. 1998;84(4):1025–1039. - PubMed
    1. Bhatnagar S, Huber R, Nowak N, Trotter P. Lesions of the posterior paraventricular thalamus block habituation of hypothalamic-pituitary-adrenal responses to repeated restraint. J Neuroendocrinol. 2002;14(5):403–410. - PubMed
    1. Bhatnagar S, Huber R, Lazar E, Pych L, Vining C. Chronic stress alters behavior in the conditioned defensive burying test: role of the posterior paraventricular thalamus. Pharmacol Biochem Behav. 2003;76(2):343–349. - PubMed

Publication types

Substances

LinkOut - more resources