

Nitric oxide release: part III. Measurement and reporting
- PMID: 22362308
- PMCID: PMC3341472
- DOI: 10.1039/c2cs15271a
Nitric oxide release: part III. Measurement and reporting
Abstract
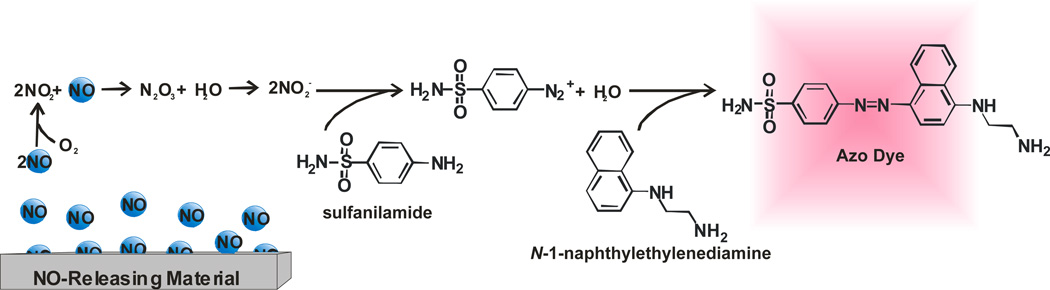
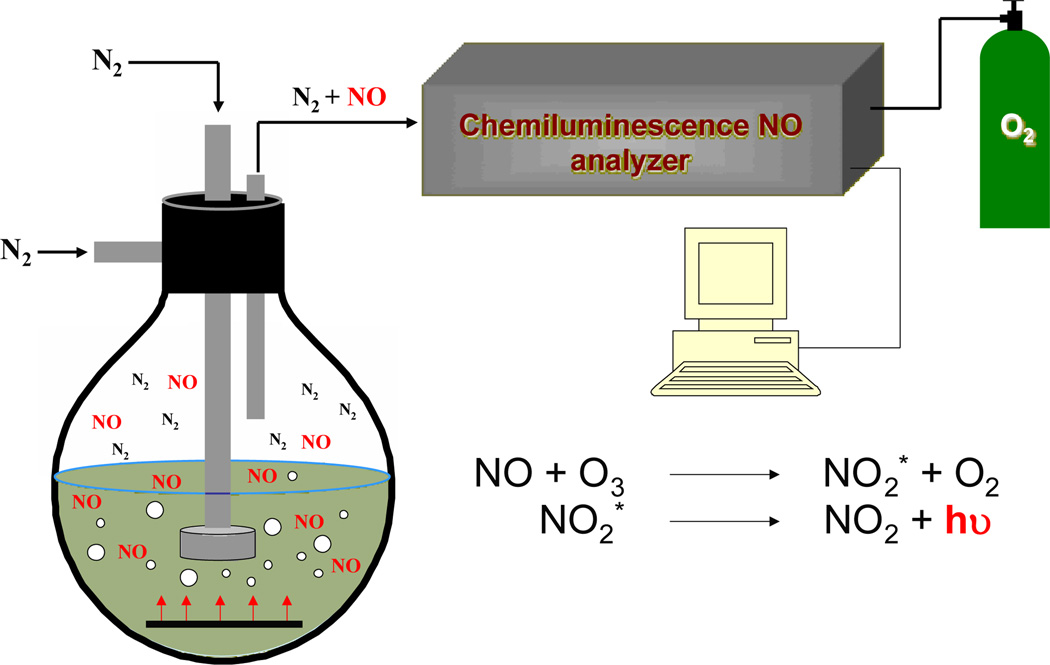
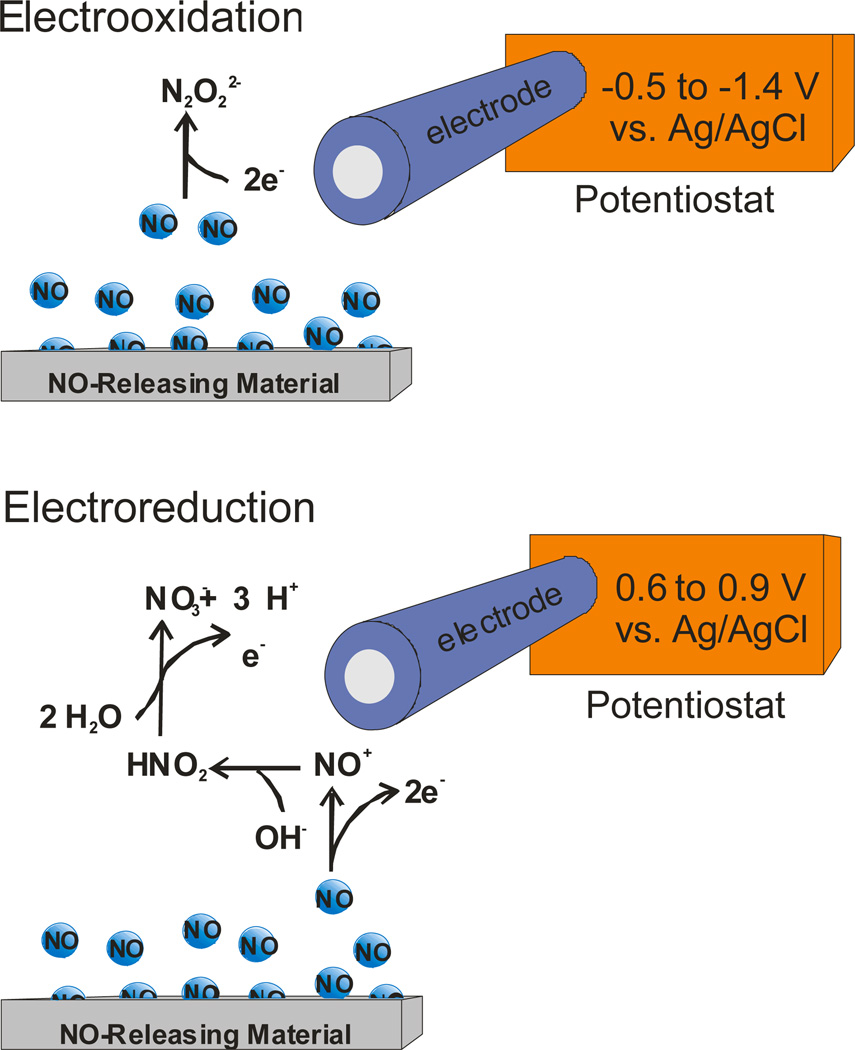
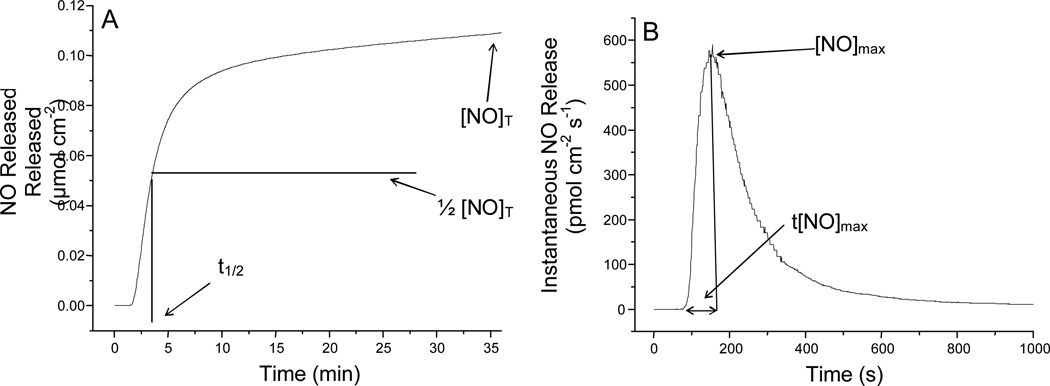
Nitric oxide's expansive physiological and regulatory roles have driven the development of therapies for human disease that would benefit from exogenous NO administration. Already a number of therapies utilizing gaseous NO or NO donors capable of storing and delivering NO have been proposed and designed to exploit NO's influence on the cardiovascular system, cancer biology, the immune response, and wound healing. As described in Nitric oxide release: Part I. Macromolecular scaffolds and Part II. Therapeutic applications, the preparation of new NO-release strategies/formulations and the study of their therapeutic utility are increasing rapidly. However, comparison of such studies remains difficult due to the diversity of scaffolds, NO measurement strategies, and reporting methods employed across disciplines. This tutorial review highlights useful analytical techniques for the detection and measurement of NO. We also stress the importance of reporting NO delivery characteristics to allow appropriate comparison of NO between studies as a function of material and intended application.
Figures
Similar articles
-
Nitric oxide release: part I. Macromolecular scaffolds.Chem Soc Rev. 2012 May 21;41(10):3731-41. doi: 10.1039/c2cs15272j. Epub 2012 Feb 24. Chem Soc Rev. 2012. PMID: 22362355 Free PMC article. Review.
-
Nitric oxide release: part II. Therapeutic applications.Chem Soc Rev. 2012 May 21;41(10):3742-52. doi: 10.1039/c2cs15273h. Epub 2012 Feb 24. Chem Soc Rev. 2012. PMID: 22362384 Free PMC article. Review.
-
Electrochemical nitric oxide sensors for physiological measurements.Chem Soc Rev. 2010 Jun;39(6):1925-35. doi: 10.1039/b701906h. Epub 2010 Mar 11. Chem Soc Rev. 2010. PMID: 20502795 Free PMC article. Review.
-
Nitric oxide detection methods in vitro and in vivo.Med Gas Res. 2019 Oct-Dec;9(4):192-207. doi: 10.4103/2045-9912.273957. Med Gas Res. 2019. PMID: 31898604 Free PMC article. Review.
-
Tuning Cellular Biological Functions Through the Controlled Release of NO from a Porous Ti-MOF.Angew Chem Int Ed Engl. 2020 Mar 23;59(13):5135-5143. doi: 10.1002/anie.201913135. Epub 2020 Feb 20. Angew Chem Int Ed Engl. 2020. PMID: 31951064
Cited by
-
Improved in vivo performance of amperometric oxygen (PO2) sensing catheters via electrochemical nitric oxide generation/release.Anal Chem. 2015 Aug 18;87(16):8067-72. doi: 10.1021/acs.analchem.5b01590. Epub 2015 Aug 5. Anal Chem. 2015. PMID: 26201351 Free PMC article.
-
Enhancing analytical accuracy of intravascular electrochemical oxygen sensors via nitric oxide release using S-nitroso-N-acetyl-penicillamine (SNAP) impregnated catheter tubing.Talanta. 2019 Dec 1;205:120077. doi: 10.1016/j.talanta.2019.06.077. Epub 2019 Jun 25. Talanta. 2019. PMID: 31450395 Free PMC article.
-
Active Release of Nitric Oxide-Releasing Dendrimers from Electrospun Polyurethane Fibers.ACS Biomater Sci Eng. 2016 Mar 14;2(3):426-437. doi: 10.1021/acsbiomaterials.6b00032. Epub 2016 Feb 29. ACS Biomater Sci Eng. 2016. PMID: 32309632 Free PMC article.
-
Design and Electrochemical Study of Platinum-Based Nanomaterials for Sensitive Detection of Nitric Oxide in Biomedical Applications.Nanomaterials (Basel). 2016 Nov 14;6(11):211. doi: 10.3390/nano6110211. Nanomaterials (Basel). 2016. PMID: 28335341 Free PMC article. Review.
-
The effect of nitric oxide surface flux on the foreign body response to subcutaneous implants.Biomaterials. 2012 Sep;33(27):6305-12. doi: 10.1016/j.biomaterials.2012.05.053. Epub 2012 Jun 27. Biomaterials. 2012. PMID: 22748919 Free PMC article.
References
Publication types
MeSH terms
Substances
Grants and funding
LinkOut - more resources
Full Text Sources
Other Literature Sources
Research Materials