Auditory emotion recognition impairments in schizophrenia: relationship to acoustic features and cognition
- PMID: 22362394
- PMCID: PMC3882084
- DOI: 10.1176/appi.ajp.2011.11081230
Auditory emotion recognition impairments in schizophrenia: relationship to acoustic features and cognition
Erratum in
- Am J Psychiatry. 2012 Apr;169(4):439
Abstract
Objective: Schizophrenia is associated with deficits in the ability to perceive emotion based on tone of voice. The basis for this deficit remains unclear, however, and relevant assessment batteries remain limited. The authors evaluated performance in schizophrenia on a novel voice emotion recognition battery with well-characterized physical features, relative to impairments in more general emotional and cognitive functioning.
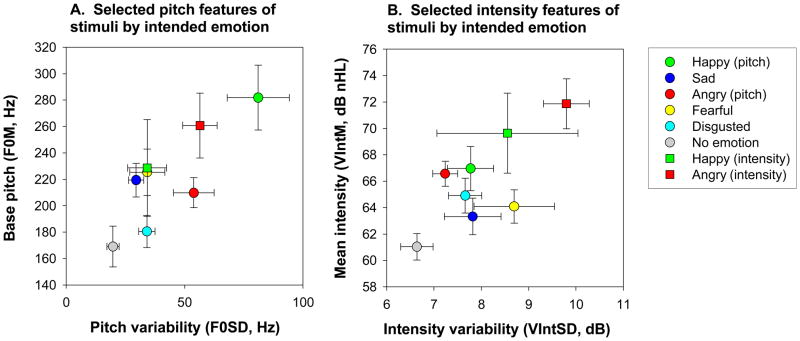
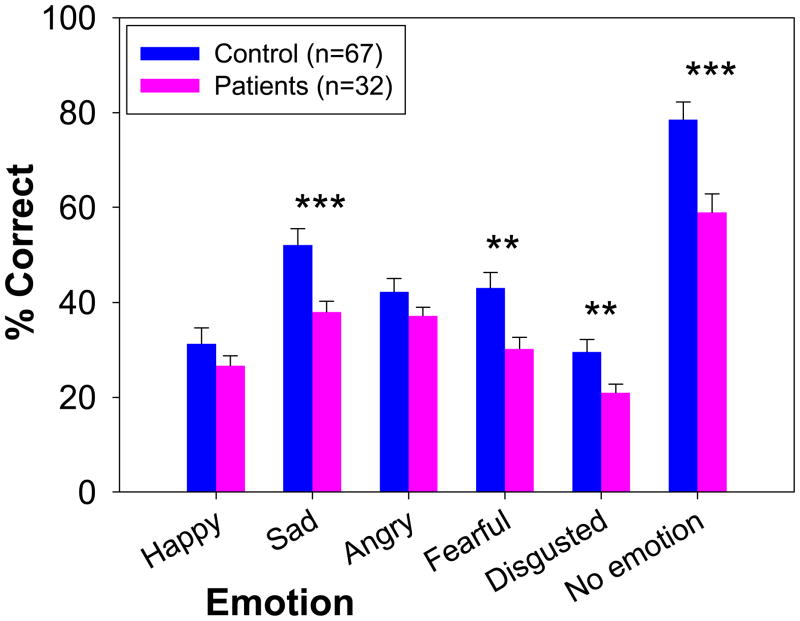
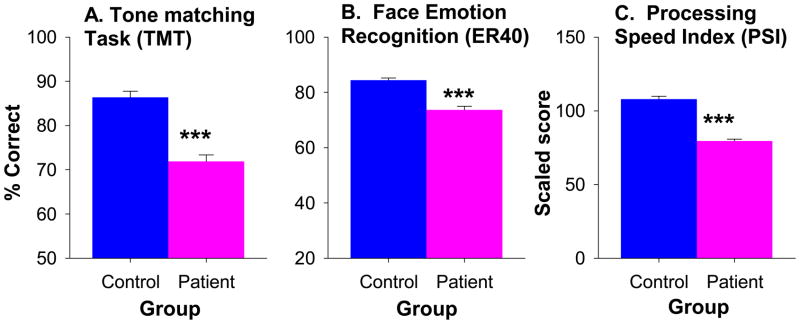
Method: The authors studied a primary sample of 92 patients and 73 comparison subjects. Stimuli were characterized according to both intended emotion and acoustic features (e.g., pitch, intensity) that contributed to the emotional percept. Parallel measures of visual emotion recognition, pitch perception, general cognition, and overall outcome were obtained. More limited measures were obtained in an independent replication sample of 36 patients, 31 age-matched comparison subjects, and 188 general comparison subjects.
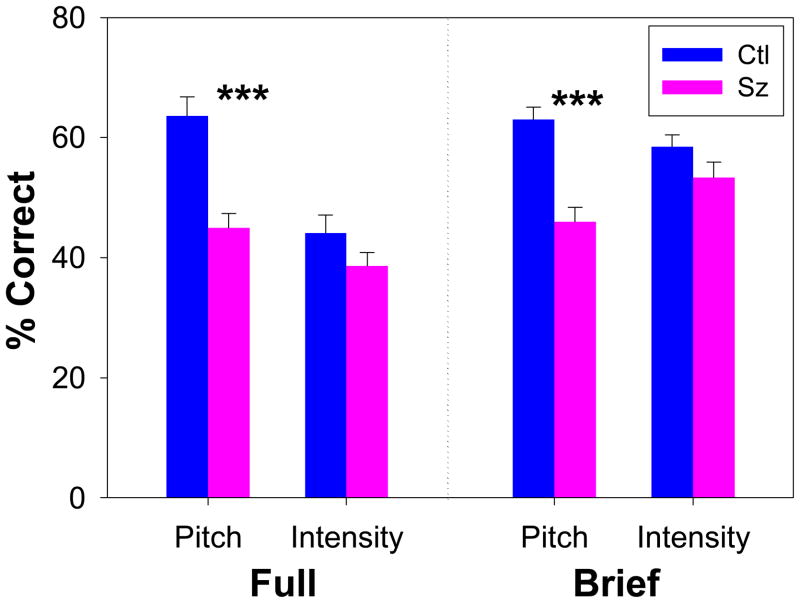
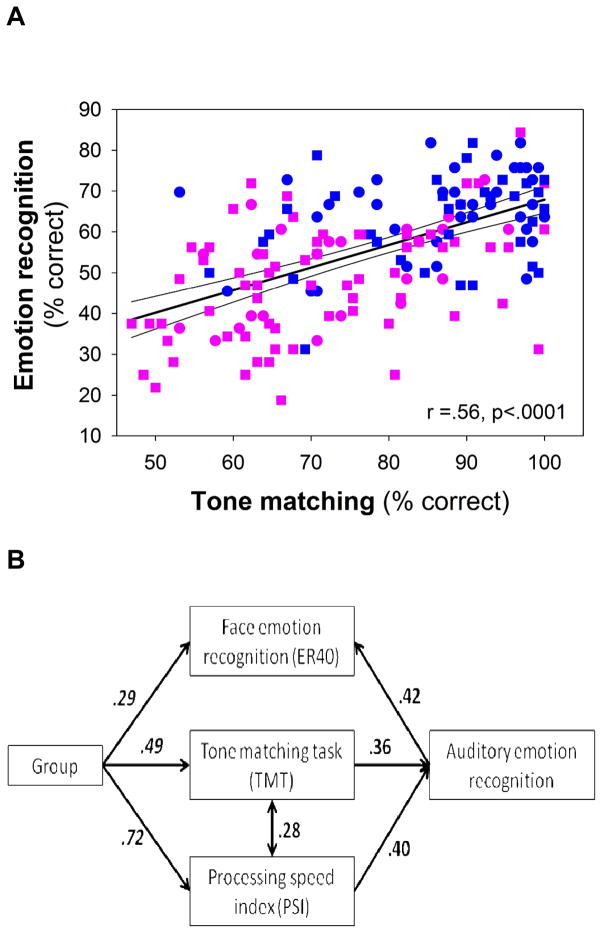
Results: Patients showed statistically significant large-effect-size deficits in voice emotion recognition (d=1.1) and were preferentially impaired in recognition of emotion based on pitch features but not intensity features. Emotion recognition deficits were significantly correlated with pitch perception impairments both across (r=0.56) and within (r=0.47) groups. Path analysis showed both sensory-specific and general cognitive contributions to auditory emotion recognition deficits in schizophrenia. Similar patterns of results were observed in the replication sample.
Conclusions: The results demonstrate that patients with schizophrenia show a significant deficit in the ability to recognize emotion based on tone of voice and that this deficit is related to impairment in detecting the underlying acoustic features, such as change in pitch, required for auditory emotion recognition. This study provides tools for, and highlights the need for, greater attention to physical features of stimuli used in studying social cognition in neuropsychiatric disorders.
Figures
Comment in
-
Clues to the cognitive and perceptual origins of social isolation and psychosis in schizophrenia.Am J Psychiatry. 2012 Apr;169(4):354-7. doi: 10.1176/appi.ajp.2012.12010042. Am J Psychiatry. 2012. PMID: 22476674 No abstract available.
References
-
- Banse R, Scherer KR. Acoustic profiles in vocal emotion expression. J Pers Soc Psychol. 1996;70(3):614–36. - PubMed
-
- Juslin PN, Laukka P. Communication of emotions in vocal expression and music performance: different channels, same code? Psychological bulletin. 2003;129(5):770–814. - PubMed
-
- Kee KS, Green MF, Mintz J, Brekke JS. Is emotion processing a predictor of functional outcome in schizophrenia? Schizophr Bull. 2003;29(3):487–97. - PubMed
-
- Brekke J, Kay DD, Lee KS, Green MF. Biosocial pathways to functional outcome in schizophrenia. Schizophr Res. 2005;80(2–3):213–25. - PubMed
Publication types
MeSH terms
Grants and funding
LinkOut - more resources
Full Text Sources
Medical