

Efficient designs of gene-environment interaction studies: implications of Hardy-Weinberg equilibrium and gene-environment independence
- PMID: 22362617
- PMCID: PMC3448495
- DOI: 10.1002/sim.4460
Efficient designs of gene-environment interaction studies: implications of Hardy-Weinberg equilibrium and gene-environment independence
Abstract
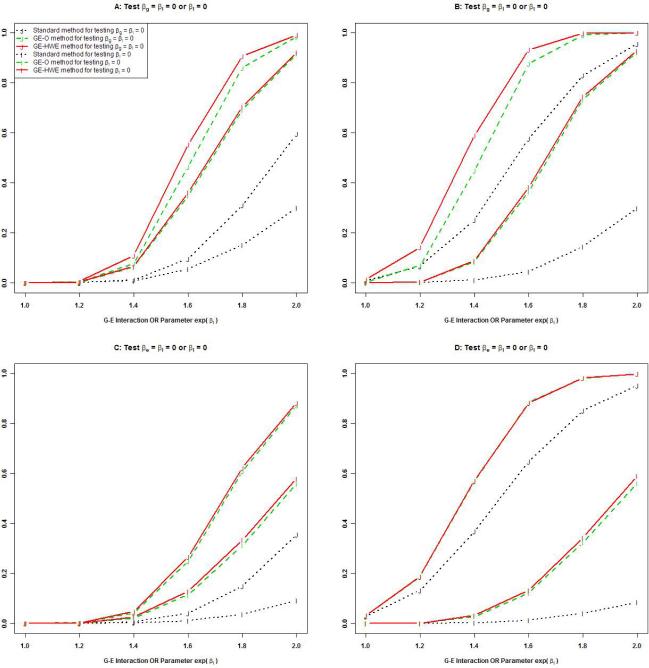
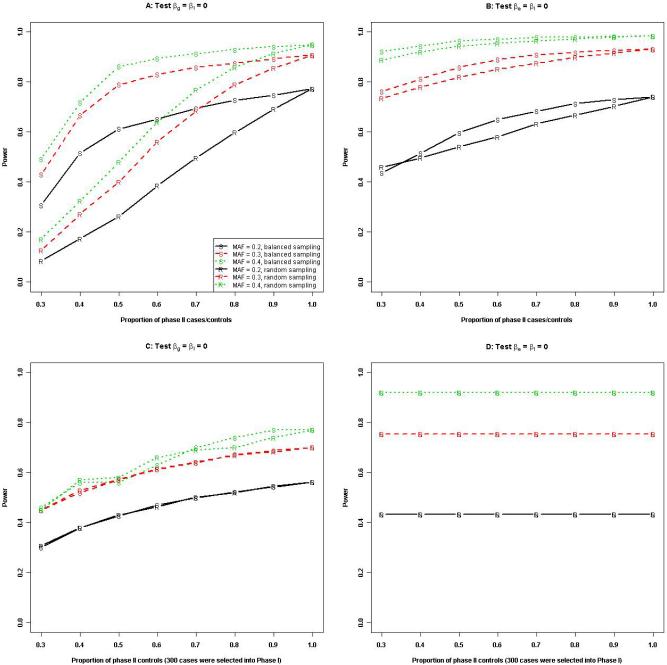
It is important to investigate whether genetic susceptibility variants exercise the same effects in populations that are differentially exposed to environmental risk factors. Here, we assess the power of four two-stage case-control design strategies for assessing multiplicative gene-environment (G-E) interactions or for assessing genetic or environmental effects in the presence of G-E interactions. We considered a di-allelic single nucleotide polymorphism G and a binary environmental variable E under the constraints of G-E independence and Hardy-Weinberg equilibrium and used the Wald statistic for all tests. We concluded that (i) for testing G-E interactions or genetic effects in the presence of G-E interactions when data for E are fully available, it is preferable to ascertain data for G in a subsample of cases with similar numbers of exposed and unexposed and a random subsample of controls; and (ii) for testing G-E interactions or environmental effects in the presence of G-E interactions when data for G are fully available, it is preferable to ascertain data for E in a subsample of cases that has similar numbers for each genotype and a random subsample of controls. In addition, supplementing external control data to an existing case-control sample leads to improved power for assessing effects of G or E in the presence of G-E interactions.
Copyright © 2012 John Wiley & Sons, Ltd.
Figures


Similar articles
-
Testing for Sufficient-Cause Gene-Environment Interactions Under the Assumptions of Independence and Hardy-Weinberg Equilibrium.Am J Epidemiol. 2015 Jul 1;182(1):9-16. doi: 10.1093/aje/kwv030. Epub 2015 May 29. Am J Epidemiol. 2015. PMID: 26025233
-
Likelihood ratio test for detecting gene (G)-environment (E) interactions under an additive risk model exploiting G-E independence for case-control data.Am J Epidemiol. 2012 Dec 1;176(11):1060-7. doi: 10.1093/aje/kws166. Epub 2012 Nov 1. Am J Epidemiol. 2012. PMID: 23118105 Free PMC article.
-
Statistical tests of genetic association for case-control study designs.Biostatistics. 2012 Sep;13(4):724-33. doi: 10.1093/biostatistics/kxs002. Epub 2012 Mar 3. Biostatistics. 2012. PMID: 22389176
-
Gene-Environment Interaction: A Variable Selection Perspective.Methods Mol Biol. 2021;2212:191-223. doi: 10.1007/978-1-0716-0947-7_13. Methods Mol Biol. 2021. PMID: 33733358 Review.
-
[Hardy-Weinberg equilibrium in genetic epidemiology].Zhong Nan Da Xue Xue Bao Yi Xue Ban. 2010 Jan;35(1):90-3. doi: 10.3969/j.issn.1672-7347.2010.01.013. Zhong Nan Da Xue Xue Bao Yi Xue Ban. 2010. PMID: 20130370 Review. Chinese.
Cited by
-
The impact of exposure-biased sampling designs on detection of gene-environment interactions in case-control studies with potential exposure misclassification.Eur J Epidemiol. 2015 May;30(5):413-23. doi: 10.1007/s10654-014-9908-1. Epub 2014 Jun 4. Eur J Epidemiol. 2015. PMID: 24894824 Free PMC article.
-
A discussion of gene-gene and gene-environment interactions and longitudinal genetic analysis of complex traits.Stat Med. 2012 Sep 28;31(22):2565-8. doi: 10.1002/sim.5495. Stat Med. 2012. PMID: 22969024 Free PMC article. No abstract available.
-
Fitting Proportional Odds Model to Case-Control data with Incorporating Hardy-Weinberg Equilibrium.Sci Rep. 2015 Nov 26;5:17286. doi: 10.1038/srep17286. Sci Rep. 2015. PMID: 26607176 Free PMC article.
-
Genome-Wide Analysis of Gene-Gene and Gene-Environment Interactions Using Closed-Form Wald Tests.Genet Epidemiol. 2015 Sep;39(6):446-55. doi: 10.1002/gepi.21907. Epub 2015 Jun 10. Genet Epidemiol. 2015. PMID: 26095143 Free PMC article.
-
Exposure enriched outcome dependent designs for longitudinal studies of gene-environment interaction.Stat Med. 2017 Aug 15;36(18):2947-2960. doi: 10.1002/sim.7332. Epub 2017 May 11. Stat Med. 2017. PMID: 28497531 Free PMC article.
References
-
- Satten GA, Kupper L. Inferences about exposure-disease associations using probability-of-exposure information. Journal of the American Statistical Association. 1993;88:200–208.
-
- Prentice RL, Pyke R. Logistic disease incidence models and case-control studies. Biometrika. 1979;66:403–411.
-
- Piegorsch W, Weinberg C, Taylor J. Non-hierarchical logistic models and case-only designs for assessing susceptibility in population-based casecontrol studies. Statistics in Medicine. 1994;13:153–162. - PubMed
-
- Umbach DM, Weinberg CR. Designing and analysing casecontrol studies to exploit independence of genotype and exposure. Statistics in Medicine. 1997;16:1731–1743. - PubMed
Publication types
MeSH terms
Grants and funding
LinkOut - more resources
Full Text Sources