. 2012 Jun;40(11):5162-70.
doi: 10.1093/nar/gks161. Epub 2012 Feb 23.

Junctions between i-motif tetramers in supramolecular structures

Affiliations

Junctions between i-motif tetramers in supramolecular structures

Eric Guittet et al. Nucleic Acids Res. 2012 Jun.

Abstract

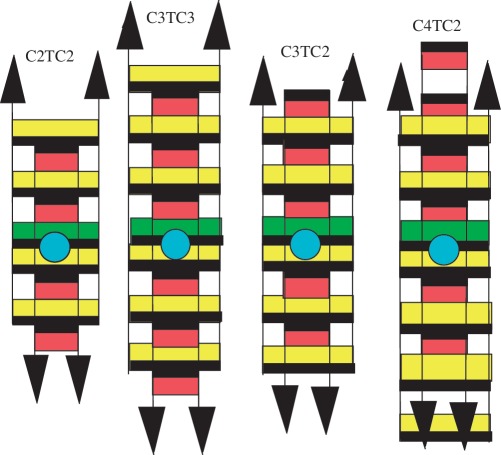
The symmetry of i-motif tetramers gives to cytidine-rich oligonucleotides the capacity to associate into supramolecular structures (sms). In order to determine how the tetramers are linked together in such structures, we have measured by gel filtration chromatography and NMR the formation and dissociation kinetics of sms built by oligonucleotides containing two short C stretches separated by a non-cytidine-base. We show that a stretch of only two cytidines either at the 3'- or 5'-end is long enough to link the tetramers into sms. The analysis of the properties of sms formed by oligonucleotides differing by the length of the oligo-C stretches, the sequence orientation and the nature of the non-C base provides a model of the junction connecting the tetramers in sms.


Figures

Figure 1.
Figure 1.
C7 association into multimers and sms. Left panel: GPC-100 chromatograms of 1.5 mM C7 solutions. The peak eluted at 8.3 min is that of thymidine, a marker used for normalization. (A) The solution incubated at 20°C shows two weak peaks. One corresponds to a tetramer (T) and the other to non-resolved (dimer+monomer) species. (B) The same sample injected in the column immediately after melting at 100°C shows an intense (dimer+monomer) peak. The comparison of both chromatograms reveals that in the non-melted sample, 95% of the oligonucleotide is incorporated in large sms that are retained on the chromatography column. Right panel: sms (red), tetramer (cyan) and (monomer + dimer) (green) equilibrium fractions in C7 solutions versus the concentration of the incubated samples. The sms proportion was determined by the comparison of chromatograms recorded before and after melting as in the left panel. The exclusion and permeation times are indicated by dashed lines.
Figure 2.
Figure 2.
C2TC5 association into tetramer and sms. The solutions were incubated and injected in the GPC-100 column at the concentrations indicated. The chromatograms recorded at low C5TC2 concentration show two components identified to a tetramer, Te, and a monomer, M, by the slope of four of the log–log plot of concentration [Te] versus [M] (right panel). When the oligonucleotide concentration increases, the continuous shift of the sms and Te peaks (arrows) indicates an exchange situation and therefore that the sms formation and dissociation times are comparable to the elution time. The dashed line shows the exclusion time.
Figure 3.
Figure 3.
Evolution during incubation at 20°C of the composition of a 0.3 mM C5TC2 solution initially melted. Left panel: The GPC-100 chromatograms are normalized to the same integrated area. The vertical scale of the chromatograms drawn in heavy lines are multiplied by a factor of five. On the chromatogram recorded at t = 0, the oligonucleotide is eluted as a monomer (M) and as a dimer (D). The anomalous elution order of D and M reflects probably the hydrodynamic radius difference between the unstructured monomer and the compact i-motif (Supplementary Figure S1). The chromatograms recorded versus time show the early formation of a tetramer (Te), the transient apparition of species including 2, 3 and 4 tetramers and the accumulation of non-resolved sms. Right panel: Evolution of the sms (red), tetramer (blue) and (monomer + dimer) (green) fractions as a function of the incubation time. The dotted line shows the exclusion time.
Figure 4.
Figure 4.
Evolution versus time at 42°C of the sms (red), tetramer (cyan) and monomer + dimer (green) fractions in a 1 mM C3TC3 solution initially monomeric. Sms accumulation in the early stage of the kinetics and final disappearance is typical of kinetics trapping.
Figure 5.
Figure 5.
Evolution versus time after initial melting of the composition of a 0.85 mM C3TC3 solution as detected by NMR and chromatography at 20°C. Right side: sms (red), tetramer (cyan) and (monomer + dimer) (green) fractions measured on chromatograms recorded as a function of the time. Left side: NMR spectra of the imino proton region. In the T imino proton region, the intensity of two narrow exchangeable peaks (11.2 and 10.95 ppm) increases as that of the tetramer peak on the chromatograms. The bottom spectrum is a magnetization transfer experiment performed at equilibrium showing the difference between a reference spectrum and a spectrum selectively irradiated during 150 ms at the position indicated by the arrow. The magnetization transfer between the two T imino proton peaks establishes that the oligonucleotide adopts two non-equivalent conformations that exchange together.
Figure 6.
Figure 6.
The intercalation topologies of the i-motif tetramers of C3TC3, C3TC2 and C4TC2. Their NMR spectra have characteristics indicating that as in [C2TC2]41 (2), the tetramers include two intercalated duplexes, one (yellow) with a T•T pair (green) stacked on the 5′-adjacent C•C+ pair and the other (red) whose thymidines are looped out in the i-motif wide grove (blue circle). A black heavy line marks the face of the bases oriented in the 5′-direction. The magnetization transfer detected between the T imino protons of each duplex establishes that concerted opening/closing of the T•T pairs switches the duplex conformations. Full intercalation topology of the tetramers of C3TC3 and C3TC2 prevents association into sms. This implies that the sms building block is a minor tetrameric species formed by a reaction parallel to that leading to the fully intercalated tetramer.
Figure 7.
Figure 7.
GPC-1000 chromatograms at 20°C of a 9 mM C3TC3 solutions and of 3 mM C5TC2 and C5GC3 solutions at equilibrium. The top horizontal scale, drawn according to the column calibration, indicates the elution positions of nucleic acids containing the indicated base numbers. The non-resolved tetramer, dimer and monomer in equilibrium with the sms are eluted in the peaks at 8.2 min. The exclusion and permeation times are indicated by dotted lines.
Figure 8.
Figure 8.
Electrophoresis on 10% (upper panel) and 6% (lower panel) PA gels of 1 and 0.3 mM C3TC3 (lanes 3 and 4 respectively) and C5TC2 (lanes 6 and 7) oligonucleotide solutions at equilibrium after incubation at room temperature. The other lanes are used for calibration with markers. Lane 1: Glu-tRNA (76 nt), Lane 2: Un-fractioned-brewer yeast tRNA (∼76 nt) and 5 s RNA contaminant (140 nt). Lanes 5 and 10: ladder ranging from 100 bp (200 nt) to 1000 bp by 100 bp increments, Lanes 8 and 9: 0.3 and 0.1 mM solutions of C5TC associated into i-motif tetramers (28 nt). Lane 11: dT9, dT24 and dT57. Lane 12: 9-mer duplex and 26-mer hairpin. In agreement with the gel filtration analysis, the C3TC3 lanes shows a band corresponding to the tetramer (28 nt) and a smear indicating structures including 100–500 nt i.e. 4–25 tetrameric repeats. The sms of C5TC2 include up to 30 tetramers. Very weak bands corresponding to [C5TC2]4 and to assemblies including two and three tetramers are detectable in lane 6.
Figure 9.
Figure 9.
Building blocks models selected for their capacities to self-associate into sms with optimal intercalation topologies. The cytidines are yellow and the thymidines are green. The purines, that are presumed unpaired, are blue. Black lines indicate the face of the bases oriented in the 5′-direction. The cytidines of the longer C stretches are associated in i-motif cores. In the building blocks of C3TC2 and C2TC3, the thymidines are paired and stacked on the 5′-adjacent C•C+ pairs, as this is observed for the thymidines intercalated in i-motif structures (14,17,18,20). Note that this model applies to C2TCn and C2TCn oligonucleotides. For each species, a section of a second identical building block is displayed with its bases in front of the position favorable for mutual intercalation into sms. The junction between the tetramer of C3TC2 involves intercalation of two bases. A single intercalation position is available to connect together the tetramers of C2TC3 and C5purC2. The difference of the number of intercalated bases in the junctions is consistent with the longer lifetimes of CnTC2 sms.

References

    1. Langridge R, Rich A. Molecular structure of helical polycytidylic acid. Nature. 1963;198:725–728. - PubMed
    1. Gehring K, Leroy JL, Guéron M. A tetrameric DNA structure with protonated cytidine·cytidine base pairs. Nature. 1993;363:561–565. - PubMed
    1. Guéron M, Leroy JL. The i-motif in nucleic acids. Curr. Opin. Struct. Biol. 2000;10:326–331. - PubMed
    1. Kang CH, Berger I, Lockshin C, Ratliff R, Moyzis R, Rich A. Crystal structure of intercalated four-stranded d(C3T) at 1.4 A resolution. Proc. Natl Acad. Sci. USA. 1994;91:11636–11640. - PMC - PubMed
    1. Yan H, Park SH, Finkelstein G, Reif JH, LaBean TN. DNA-templated self-assembly of protein arrays and highly conductive nanowires. Science. 2003;301:1882–1884. - PubMed

Publication types