. 2012 Jun;40(11):4861-78.
doi: 10.1093/nar/gks162. Epub 2012 Feb 22.

Function of homo- and hetero-oligomers of human nucleoplasmin/nucleophosmin family proteins NPM1, NPM2 and NPM3 during sperm chromatin remodeling

Affiliations

Function of homo- and hetero-oligomers of human nucleoplasmin/nucleophosmin family proteins NPM1, NPM2 and NPM3 during sperm chromatin remodeling

Mitsuru Okuwaki et al. Nucleic Acids Res. 2012 Jun.

Abstract

Sperm chromatin remodeling after oocyte entry is the essential step that initiates embryogenesis. This reaction involves the removal of sperm-specific basic proteins and chromatin assembly with histones. In mammals, three nucleoplasmin/nucleophosmin (NPM) family proteins-NPM1, NPM2 and NPM3-expressed in oocytes are presumed to cooperatively regulate sperm chromatin remodeling. We characterized the sperm chromatin decondensation and nucleosome assembly activities of three human NPM proteins. NPM1 and NPM2 mediated nucleosome assembly independently of other NPM proteins, whereas the function of NPM3 was largely dependent on formation of a complex with NPM1. Maximal sperm chromatin remodeling activity of NPM2 required the inhibition of its non-specific nucleic acid-binding activity by phosphorylation. Furthermore, the oligomer formation with NPM1 elicited NPM3 nucleosome assembly and sperm chromatin decondensation activity. NPM3 also suppressed the RNA-binding activity of NPM1, which enhanced the nucleoplasm-nucleolus shuttling of NPM1 in somatic cell nuclei. Our results proposed a novel mechanism whereby three NPM proteins cooperatively regulate chromatin disassembly and assembly in the early embryo and in somatic cells.


Figures
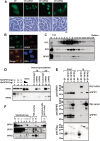
Figure 1.
Figure 1.
Association between human NPM proteins. (A) Localization of EGFP-tagged NPM proteins. EF, EF–NPM1, EF–NPM2 and EF–NPM3 were transiently expressed in HeLa cells and the localization of EGFP proteins was examined by fluorescent microscopy. Bottom panels are phase contrast images. Bar at the bottom indicates 10 µm. (B) Localization of endogenous NPM1 and NPM3 in HeLa cells. HeLa cells were subjected to immunofluorescence analysis using anti-NPM1 and anti-NPM3 antibodies. DNA was stained with TO-PRO-3. Images were observed under confocal microscopy. Bar at the bottom indicates 10 µm. (C) Glycerol density gradient of HeLa cell nuclear extracts. Nuclear extracts from HeLa cells were fractionated by 15–35% glycerol density gradient. Fractions collected from the top were analyzed by western blotting with anti-nucleolin (NCL), anti-B23 and anti-NPM3 antibodies. (D) Immunoprecipitation with anti-NPM proteins. HeLa cell extracts were subjected to immunoprecipitation with control Ig (lanes 6 and 9), anti-NPM1 (lanes 7 and 10), and anti-NPM3 (lanes 8 and 11) antibodies. Bound proteins were eluted with SDS-sample buffer (30 µl) and 3 (lanes 6–8) or 9 (lanes 9–11) µl of samples were separated on SDS–PAGE and analyzed by western blotting with anti-NPM1 and anti-NPM3 antibodies (top and bottom panels, respectively). As standard, recombinant His-NPM1 (50, 25, 12 ng for lanes 1–3) and His–NPM3 (5, 2.5, 1.2 ng for lanes 1–3), and increasing amounts of input extracts (lanes 4–5) were also loaded. (E) Immunoprecipitation of transiently expressed NPM proteins. EF, EF–NPM1, -NPM2 and -NPM3 were transiently expressed in HEK293T cells and cell extracts were prepared. Immunoprecipitation with anti-Flag antibody beads was performed. Input (lanes 1–4) and immunoprecipitated (lanes 5–8) proteins were analyzed by western blotting with anti-NPM1, -NPM3 and -Flag antibodies. Positions of NPM proteins are indicated at the right side of the panel. Blank arrow head shows the protein likely to be corresponded to NPM3 degradation product. (F) Expression level of NPM proteins in mouse MII oocytes. MII oocytes (30 and 60 cells for lanes 7 and 8, respectively) and cumulus cells (3 × 103 and 10 × 103 cells for lanes 9 and 10) were prepared from mice and analyzed by western blotting with anti-NPM1, -NPM3 and -NPM2 antibodies. Recombinant human NPM1 and mouse NPM3 were loaded on the same gel as standards (lanes 1–6). Positions of NPM proteins are indicated by arrow heads.
Figure 2.
Figure 2.
Oligomer formation of human NPM proteins. (A) Chemical crosslinking experiments. His-tagged NPM1, NPM2 and NPM3 (200 ng each) were treated without (lanes 1, 3 and 5) or with (lanes 2, 4 and 6) 0.05% glutaraldehyde (GA) and the fixed proteins were separated on 7.5% and 12.5% SDS–PAGE (top and bottom panels, respectively). Proteins were analyzed by western blotting with anti-His-tag antibody. Positions of molecular weight markers are indicated at the left side of the panels. (B) BN–PAGE analysis of NPM proteins. Recombinant His-tagged NPM1 (34.5 kDa), NPM2 (26.3 kDa) and NPM3 (21.5 kDa) (500 ng) were separated by 4–16% BN–PAGE and visualized with CBB staining. Lane M indicates molecular weight markers. The mobility of marker proteins was plotted as a function of their molecular weights (Mw) (right panel). The marker proteins were linearly separated and the masses of NPM proteins were estimated as shown at the right side of the gel. (C) Limited proteolysis of human NPM proteins. His-tagged NPM1, NPM2 and NPM3 were treated without or with increasing amounts of trypsin and incubated at 37°C for 5 min. Then the proteins were separated on 15% SDS–PAGE followed by CBB staining (Red) or western blotting with anti-His-tag antibody (Green). Positions of bands corresponding to the NPM core are indicated by arrow heads. CBB-stained gel and western blotting images are merged and shown in the top panel. (D) Alignment of the amino acid sequences of human NPM N-terminal domains. Amino acid sequences of human NPM1, NPM2 and NPM3 were aligned by ClastalW2 software (http://www.ebi.ac.uk/Tools/msa/clustalw2/) and conserved amino acids are highlighted by asterisks at the bottom of sequences. The conserved core domains of NPM proteins are indicated on blue background. The position of acidic ‘A1 tract’ is shown by red line at the top of the sequences.
Figure 3.
Figure 3.
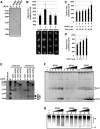
Sperm chromatin remodeling by human NPM proteins. (A) Purified proteins. His-tagged NPM proteins were expressed in E. coli and purified. Proteins (200 ng each) were separated by 12.5% SDS–PAGE and visualized with CBB staining. Positions of molecular weight markers are indicated at the left side of the panel. (B) Sperm chromatin decondensation by NPMs. Mouse sperm nuclei (1 × 105) were incubated for 60 min without or with 3 µg of purified NPM1, NPM2, or NPM3. Sperm nuclei were fixed with formardehyde and stained with DAPI. Bar at the bottom of the panels indicates 10 µm. Four typical sperm nuclei are shown for each sample. Size of the sperm nuclei (n > 30) were estimated by Image J software and averaged. Results are means ± SD and statistical P-values were calculated and indicated * for P < 0.05. (C and D) Sperm chromatin decondensation by NPM1. Sperm nuclei were incubated in the presence or absence of NPM1 and incubated for 10–60 min as indicated at the bottom of the graph (C) or for 60 min (D). Size of sperm nuclei was analyzed as in (B). (E) Histone-binding activity of human NPM proteins. GST, GST-tagged NPM1, NPM2, and NPM3 (1 µg each) were mixed without (lanes 1–4) or with core histones (1 µg, lanes 5–8) purified from HeLa cells in the buffer containing 150 mM NaCl. The mixtures were recovered by glutathione sepharose beads. The proteins were separated by 15% SDS–PAGE and visualized with silver staining. Positions of molecular weight markers and core histones are shown at the left and right side of the panel, respectively. (F) Histone transfer assay. Increasing amounts of His-tagged NPM1, NPM2 and NPM3 (lanes 2–6, 7–11 and 12–16, respectively) (50, 100, 200, 300 and 400 ng for each protein) were incubated with core histones (100 ng) and incubated. Then the 147-bp DNA fragment (30 ng) were added and further incubated at 37°C for 30 min. The mixtures were separated by 6% PAGE in 0.5× TBE. DNA was visualized by staining with GelRed. Positions of free DNA and nucleosome core particle (NCP) are indicated at the right side of the panel. (G) Supercoiling assay. His-tagged NPM1, NPM2 and NPM3 (100, 300, and 1000 ng for lanes 2–4, 5–7 and 8–10) were incubated with core histones (100 ng). Then plasmid DNA (100 ng) treated with topoisomerase I was added to NPM-histone mixture and incubated. Plasmid DNA was purified and analyzed by 1% agarose gel electrophoresis in 1× TBE and visualized with GelRed staining. Positions of relaxed (R) and supercoiled (S) DNA are indicated at the right side of the panel.
Figure 4.
Figure 4.
Effect of phosphorylation on NPM2 sperm chromatin remodeling activity. (A) Phosphorylation of recombinant NPM2. Purified His–NPM2 was mixed and incubated without or with asynchronous (+Asyn) or mitotic (+M) HeLa cell extracts followed by purification with the Ni-NTA resin. Dialyzed proteins (200 ng) were separated on 10% SDS–PAGE and visualized with CBB and Pro-Q Diamond staining (lanes 1–3 and 4–6, respectively). The 45-kDa marker protein (ovalbumin) was detected by Pro-Q Diamond staining. Positions of molecular weight markers are indicated at the left side of the panel. (B) DNA-binding activity of recombinant NPM2. The 196-bp DNA fragment (100 ng) were mixed with increasing amounts (100, 200, 400 and 800 ng for each protein) of control NPM2 (lanes 2–5) or NPM2 phosphorylated by asynchronous (lanes 6–9) or mitotic (lanes 10–13) extracts. The mixtures were analyzed by native PAGE in 0.5× TBE and DNA was visualized with GelRed staining. (C) Phosphorylation of NPM2 mutants by extracts. NPM2 wild type (wt), S159D, S196D, S159/196D (2D), 5D and 7D mutant proteins (500 ng) were incubated with asynchronous (lanes 1–7) or mitotic (lanes 8–14) cell extracts (5 µg of proteins) and SDS-sample buffer was added. Proteins were analyzed by SDS–PAGE and Pro-Q diamond or CBB staining (top and bottom panels, respectively). Positions of NPM2 proteins are indicated by arrow heads at the right side of the panels. (D) Sperm chromatin decondensation by NPM2 proteins. Mouse sperm nuclei were incubated in the absence or presence of NPM2 wt, 2D, 5D and 7D (3 μg) and the size of sperm nuclei (n > 30) were estimated by Image J software and averaged. Results are means ± SD and statistical P-values were calculated and indicated by asterisk for P < 0.05. (E) Histone transfer activity of phosphorylated NPM2. Histone transfer assay was performed as in Figure 3F with increasing amounts (100, 200, 300 and 400 ng for each protein) of NPM2 wt, S159D, S196D, 2D, 5D and 7D. The mixtures were separated on 6% PAGE in 0.5× TBE and DNA was visualized with GelRed staining. Positions of free DNA and NCP are indicated at the right side of the panel.
Figure 5.
Figure 5.
NPM3 functions as a histone chaperone when it forms an oligomer. (A) Purified recombinant proteins. His-tagged NPM1, NPM3, NPM1ΔC3 and NPM1–3Ch (lanes 1–4, respectively, 200 ng each) were separated by 12.5% SDS–PAGE and visualized with CBB staining. Because the oligomers of NPM1–3Ch and NPM1ΔC3 were not completely disrupted under SDS–PAGE condition, two bands, 18- and 70-kDa bands for NPM1ΔC3 and 25 and 100-kDa bands for NPM1–3Ch, were detected. The protein amounts of NPM1ΔC3 and NPM1–3Ch were estimated by the sum of two bands. The proteins used are schematically represented at the right side of the panel. The NPM1–3Ch protein is a fusion of NPM1(1–120) and NPM3(146–178). (B) Sperm chromatin decondensation activity. Mouse sperm nuclei were incubated in the absence or presence of NPM proteins (3 μg) at 37°C for 60 min, fixed, and stained with DAPI. Three typical sperm nuclei are shown. (C) Supercoiling assay. Core histones were incubated without or with increasing amounts of NPM1 (lanes 2–4), NPM3 (lanes 5–7), NPM1ΔC3 (lanes 8–10) and NPM1–3Ch (lanes 11–13) (100, 300 and 1000 ng for each protein). Then the topoisomerase I-treated plasmid DNA (100 ng) was added and incubated. DNA was purified and separated on 1% agarose gel electrophoresis in 1× TBE. Positions of supercoiled (S) and relaxed (R) plasmid DNA are shown at the right side of the panel.
Figure 6.
Figure 6.
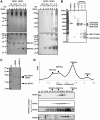
Oligomer formation between NPM1 and NPM3. (A) Crosslinking experiments. Recombinant His–NPM1 was mixed with increasing amounts of His–NPM3 (1:0 for lanes 1 and 2, 1:0.2 for lanes 3 and 4, 1:1 for lanes 5 and 6, and 1:3 for lanes 7 and 8), denatured in the buffer containing guanidine hydrochloride, and renatured by extensive dialysis. The mixtures were subjected to chemical crosslinking experiment with 0.05% GA. The mixtures treated without (lanes 1, 3, 5 and 7) or with (lanes 2, 4, 6 and 8) GA were separated on 7.5% and 12.5% SDS–PAGE (top and bottom panels, respectively) and visualized with silver staining (left panel) or western blotting with an anti-NPM3 antibody (right panel). Positions of molecular weight markers are indicated at the left, and those of free NPM1 and NPM3 are indicated at the right side of the panel. (B) BN–PAGE analysis of the NPM1–NPM3 complex. NPM1, NPM3 and NPM1–NPM3 complexes as in A were separated on 4–16% BN–PAGE and visualized with silver staining. Lane M is molecular weight markers. Masses of bands shown at the right side of the panel were estimated as in Figure 2B. (C) NPM1/His–NPM3 preparation. His-tagged NPM3 and NPM1 were coexpressed in E. coli and purified as described in ‘Materials and Methods’ section. His–NPM1 and NPM1–His–NPM3 complex were separated on 12.5% SDS–PAGE and visualized with CBB staining. Positions of His–NPM1, non-tagged NPM1 and His–NPM3 are indicated at the right side of the panel. (D) Gel filtration analysis of NPM proteins. His–NPM1 (5 µg), NPM1/His–NPM3 (5 µg NPM1) and His–NPM2 (5 µg) in 20 µl were loaded on Superose 6 PC 3.2/30 column and fractionated. Fractions 12–24 were analyzed by SDS–PAGE and western blotting. Molecular masses were estimated from the elution profile of marker proteins as shown at the top of the panel.
Figure 7.
Figure 7.
Sperm chromatin remodeling activity of the NPM1–NPM3 complex. (A) Sperm chromatin decondensation activity of the NPM1–NPM3 complex. Sperm nuclei in the absence or presence of His–NPM1, NPM1–His–NPM3 complex (NPM1/3), His–NPM3 prepared as in Figure 6C were incubated for 30 or 60 min. Sperm DNA was fixed and stained with DAPI, and observed by fluorescent microscopy. Three typical sperms (from 60 min incubation samples) are shown for each sample. Sperm nuclear size (n > 30) was estimated by Image J and averaged. Results are means ± SD. (B) Nucleosome assembly activity of the NPM1–NPM3 complex. Increasing amounts of His–NPM1, NPM3, and the NPM1–His–NPM3 complex (NPM1/3) (200, 600 and 2000 ng, for lanes 2–4, 5–7 and 8–10) were mixed with core histones (100 ng). Topo I-treated plasmid DNA (100 ng) was added and further incubated. DNA was purified, separated on 1% agarose gel and visualized with GelRed staining. Positions of relaxed (R) and supercoilied (S) DNA are indicated at the right side of the panel.
Figure 8.
Figure 8.
Effects of NPM3 incorporation into the NPM1 pentamer on the NPM1 functions in somatic cells. (A) Purified GST–NPM1/His–NPM3 oligomer. GST–NPM1 was first purified and denatured in the absence or presence of three times molar excess of His–NPM3, the mixtures were dialyzed to refold the proteins and the excess His–NPM3 was removed by purification of the proteins with glutathione sepharose. GST, GST–NPM1 and GST–NPM1/His–NPM3 (lanes 1–3, respectively, 200 ng of GST proteins) were separated on 12.5% SDS–PAGE and visualized with CBB staining. (B) RNA-binding activity of the NPM1–NPM3 complex. Increasing amounts of GST–NPM1 and GST–NPM1/His–NPM3 were mixed with 32P-labeled total RNA purified from HeLa cells. The mixture was filtrated through nitrocellulose membrane. The membrane was extensively washed and the radio-active RNA retained on the membrane was detected by BAS2500 image analyzing system (top panel). Experiments were performed with doublet and the average radioactivity of the retained RNA is graphically shown at the bottom. The radio-active RNA incubated in the absence of NPM proteins (lane 1) retained on the membrane was set as 1.0 and relative amounts of retained RNA were measured. Two independent experiments demonstrated similar results. (C) Depletion of NPM1 from the extracts. NPM1 was immune-depleted from the extracts prepared from HeLa cells stably expressing EF–NPM3 using an anti-NPM1 antibody. Increasing amounts (1, 3 and 10 µg of proteins) of mock- and NPM1-depleted extracts (lanes 1–3 and 4–6, respectively) were separated by SDS–PAGE and analyzed by western blotting with anti-Flag, anti-NPM1 and anti-PCNA antibodies. (D) FRAP analysis of NPM1 and NPM3. HeLa cells stably expressing either EF–NPM1 or EF–NPM3 were grown on the glass-base dishes. FRAP analyses were performed as described in ‘Materials and Methods’ section. Small nucleoli as shown by white circle in the left panels were breached by a 488-nm laser and the fluorescent recovery at the bleached nucleoli was measured every 0.5 s. The fluorescence at the bleached area relative to the initial fluorescence (1.0) was calculated and plotted as a function of time. The data are represented as mean values ± SD from 12 and 10 experiments for NPM1 and NPM3, respectively. The t1/2 of fluorescence recovery (7.10 and 4.29 s for NPM1 and NPM3, respectively) was estimated by curve fitting as described in ‘Materials and Methods’ section. Typical FRAP images of EF–NPM1 and EF–NPM3 before bleaching, and 0 and 6.2 s after bleaching are shown at the bottom.

Similar articles

Cited by

References

    1. Laskey RA, Honda BM, Mills AD, Finch JT. Nucleosomes are assembled by an acidic protein which binds histones and transfers them to DNA. Nature. 1978;275:416–420. - PubMed
    1. Philpott A, Leno GH. Nucleoplasmin remodels sperm chromatin in Xenopus egg extracts. Cell. 1992;69:759–767. - PubMed
    1. Tamada H, Van Thuan N, Reed P, Nelson D, Katoku-Kikyo N, Wudel J, Wakayama T, Kikyo N. Chromatin decondensation and nuclear reprogramming by nucleoplasmin. Mol. Cell Biol. 2006;26:1259–1271. - PMC - PubMed
    1. Sylvestre EL, Pennetier S, Bureau M, Robert C, Sirard MA. Investigating the potential of genes preferentially expressed in oocyte to induce chromatin remodeling in somatic cells. Cell Reprogram. 2010;12:519–528. - PubMed
    1. Burns KH, Viveiros MM, Ren Y, Wang P, DeMayo FJ, Frail DE, Eppig JJ, Matzuk MM. Roles of NPM2 in chromatin and nucleolar organization in oocytes and embryos. Science. 2003;300:633–636. - PubMed

Publication types