

Environment of TyrZ in photosystem II from Thermosynechococcus elongatus in which PsbA2 is the D1 protein
- PMID: 22362776
- PMCID: PMC3333167
- DOI: 10.1074/jbc.M112.340323
Environment of TyrZ in photosystem II from Thermosynechococcus elongatus in which PsbA2 is the D1 protein
Abstract
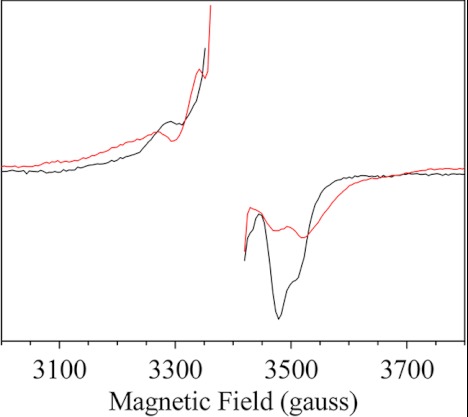
The main cofactors that determine the photosystem II (PSII) oxygen evolution activity are borne by the D1 and D2 subunits. In the cyanobacterium Thermosynechococcus elongatus, there are three psbA genes coding for D1. Among the 344 residues constituting D1, there are 21 substitutions between PsbA1 and PsbA3, 31 between PsbA1 and PsbA2, and 27 between PsbA2 and PsbA3. Here, we present the first study of PsbA2-PSII. Using EPR and UV-visible time-resolved absorption spectroscopy, we show that: (i) the time-resolved EPR spectrum of Tyr(Z)(•) in the (S(3)Tyr(Z)(•))' is slightly modified; (ii) the split EPR signal arising from Tyr(Z)(•) in the (S(2)Tyr(Z)(•))' state induced by near-infrared illumination at 4.2 K of the S(3)Tyr(Z) state is significantly modified; and (iii) the slow phases of P(680)(+) reduction by Tyr(Z) are slowed down from the hundreds of μs time range to the ms time range, whereas both the S(1)Tyr(Z)(•) → S(2)Tyr(Z) and the S(3)Tyr(Z)(•) → S(0)Tyr(Z) + O(2) transition kinetics remained similar to those in PsbA(1/3)-PSII. These results show that the geometry of the Tyr(Z) phenol and its environment, likely the Tyr-O···H···Nε-His bonding, are modified in PsbA2-PSII when compared with PsbA(1/3)-PSII. They also point to the dynamics of the proton-coupled electron transfer processes associated with the oxidation of Tyr(Z) being affected. From sequence comparison, we propose that the C144P and P173M substitutions in PsbA2-PSII versus PsbA(1/3)-PSII, respectively located upstream of the α-helix bearing Tyr(Z) and between the two α-helices bearing Tyr(Z) and its hydrogen-bonded partner, His-190, are responsible for these changes.
Figures


Similar articles
-
The D1-173 amino acid is a structural determinant of the critical interaction between D1-Tyr161 (TyrZ) and D1-His190 in Photosystem II.Biochim Biophys Acta. 2014 Dec;1837(12):1922-1931. doi: 10.1016/j.bbabio.2014.08.008. Biochim Biophys Acta. 2014. PMID: 25193561
-
The Tll0287 protein is a hemoprotein associated with the PsbA2-Photosystem II complex in Thermosynechococcus elongatus.Biochim Biophys Acta. 2013 Oct;1827(10):1174-82. doi: 10.1016/j.bbabio.2013.06.002. Epub 2013 Jun 14. Biochim Biophys Acta. 2013. PMID: 23770319
-
Crystal structures of photosystem II from a cyanobacterium expressing psbA2 in comparison to psbA3 reveal differences in the D1 subunit.J Biol Chem. 2022 Dec;298(12):102668. doi: 10.1016/j.jbc.2022.102668. Epub 2022 Nov 2. J Biol Chem. 2022. PMID: 36334624 Free PMC article.
-
Some Photosystem II properties depending on the D1 protein variants in Thermosynechococcus elongatus.Biochim Biophys Acta. 2014 Sep;1837(9):1427-34. doi: 10.1016/j.bbabio.2013.12.011. Epub 2014 Jan 2. Biochim Biophys Acta. 2014. PMID: 24388918 Review.
-
Low-barrier hydrogen bond plays key role in active photosystem II--a new model for photosynthetic water oxidation.Biochim Biophys Acta. 2007 Jun;1767(6):493-9. doi: 10.1016/j.bbabio.2006.12.008. Epub 2006 Dec 23. Biochim Biophys Acta. 2007. PMID: 17254545 Review.
Cited by
-
Origin and Evolution of Water Oxidation before the Last Common Ancestor of the Cyanobacteria.Mol Biol Evol. 2015 May;32(5):1310-28. doi: 10.1093/molbev/msv024. Epub 2015 Feb 4. Mol Biol Evol. 2015. PMID: 25657330 Free PMC article.
-
Photosynthetic Versatility in the Genome of Geitlerinema sp. PCC 9228 (Formerly Oscillatoria limnetica 'Solar Lake'), a Model Anoxygenic Photosynthetic Cyanobacterium.Front Microbiol. 2016 Oct 13;7:1546. doi: 10.3389/fmicb.2016.01546. eCollection 2016. Front Microbiol. 2016. PMID: 27790189 Free PMC article.
-
Crystal structure and redox properties of a novel cyanobacterial heme protein with a His/Cys heme axial ligation and a Per-Arnt-Sim (PAS)-like domain.J Biol Chem. 2017 Jun 9;292(23):9599-9612. doi: 10.1074/jbc.M116.746263. Epub 2017 Apr 20. J Biol Chem. 2017. PMID: 28428249 Free PMC article.
-
Reconstructing the Origin of Oxygenic Photosynthesis: Do Assembly and Photoactivation Recapitulate Evolution?Front Plant Sci. 2016 Mar 2;7:257. doi: 10.3389/fpls.2016.00257. eCollection 2016. Front Plant Sci. 2016. PMID: 26973693 Free PMC article.
-
A fresh look at the evolution and diversification of photochemical reaction centers.Photosynth Res. 2015 Oct;126(1):111-34. doi: 10.1007/s11120-014-0065-x. Epub 2014 Dec 16. Photosynth Res. 2015. PMID: 25512103 Free PMC article. Review.
References
-
- Ferreira K. N., Iverson T. M., Maghlaoui K., Barber J., Iwata S. (2004) Architecture of the photosynthetic oxygen-evolving center. Science 303, 1831–1838 - PubMed
-
- Guskov A., Kern J., Gabdulkhakov A., Broser M., Zouni A., Saenger W. (2009) Cyanobacterial photosystem II at 2.9-Å resolution and the role of quinones, lipids, channels, and chloride. Nat. Struct. Mol. Biol. 16, 334–342 - PubMed
-
- Umena Y., Kawakami K., Shen J. R., Kamiya N. (2011) Crystal structure of oxygen-evolving photosystem II at a resolution of 1.9 Å. Nature 473, 55–60 - PubMed
-
- Diner B. A., Rappaport F. (2002) Structure, dynamics, and energetics of the primary photochemistry of photosystem II of oxygenic photosynthesis. Annu. Rev. Plant. Biol. 53, 551–580 - PubMed
-
- Renger G. (2011) Light-induced oxidative water splitting in photosynthesis: energetics, kinetics, and mechanism. J. Photochem. Photobiol. B 104, 35–43 - PubMed
Publication types
MeSH terms
Substances
LinkOut - more resources
Full Text Sources
