. 2012 Apr;158(4):1933-43.
doi: 10.1104/pp.111.192880. Epub 2012 Feb 23.

A revised architecture of primary cell walls based on biomechanical changes induced by substrate-specific endoglucanases

Affiliations

A revised architecture of primary cell walls based on biomechanical changes induced by substrate-specific endoglucanases

Yong Bum Park et al. Plant Physiol. 2012 Apr.

Abstract

Xyloglucan is widely believed to function as a tether between cellulose microfibrils in the primary cell wall, limiting cell enlargement by restricting the ability of microfibrils to separate laterally. To test the biomechanical predictions of this "tethered network" model, we assessed the ability of cucumber (Cucumis sativus) hypocotyl walls to undergo creep (long-term, irreversible extension) in response to three family-12 endo-β-1,4-glucanases that can specifically hydrolyze xyloglucan, cellulose, or both. Xyloglucan-specific endoglucanase (XEG from Aspergillus aculeatus) failed to induce cell wall creep, whereas an endoglucanase that hydrolyzes both xyloglucan and cellulose (Cel12A from Hypocrea jecorina) induced a high creep rate. A cellulose-specific endoglucanase (CEG from Aspergillus niger) did not cause cell wall creep, either by itself or in combination with XEG. Tests with additional enzymes, including a family-5 endoglucanase, confirmed the conclusion that to cause creep, endoglucanases must cut both xyloglucan and cellulose. Similar results were obtained with measurements of elastic and plastic compliance. Both XEG and Cel12A hydrolyzed xyloglucan in intact walls, but Cel12A could hydrolyze a minor xyloglucan compartment recalcitrant to XEG digestion. Xyloglucan involvement in these enzyme responses was confirmed by experiments with Arabidopsis (Arabidopsis thaliana) hypocotyls, where Cel12A induced creep in wild-type but not in xyloglucan-deficient (xxt1/xxt2) walls. Our results are incompatible with the common depiction of xyloglucan as a load-bearing tether spanning the 20- to 40-nm spacing between cellulose microfibrils, but they do implicate a minor xyloglucan component in wall mechanics. The structurally important xyloglucan may be located in limited regions of tight contact between microfibrils.


Figures

Figure 1.
Figure 1.
Cartoon of the tethered network model of the primary cell wall, in which xyloglucans (thin strands) bind to the surface of cellulose microfibrils (thick rods), forming a load-bearing network (redrawn after Albersheim et al. [2011] and Pauly et al. [1999]). The semicircle (top left) represents the approximate size of a family-12 endoglucanase used in this study, assuming microfibrils with 20-nm spacing. The microfibrils and the xyloglucan would be longer than what is represented here. [See online article for color version of this figure.]
Figure 2.
Figure 2.
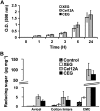
Hydrolytic activities of family-12 endoglucanases. A, Time course for hydrolysis of azurine cross-linked XyG. Hydrolysis by CEG was not detected. O.D., Optical density. B, Comparison of the hydrolysis of different forms of celluloses as measured by the release of reducing sugars. CMC, Carboxymethyl cellulose. Error bars show 95% confidence intervals (±1.96 × se; n = 3).
Figure 3.
Figure 3.
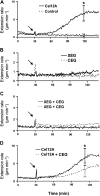
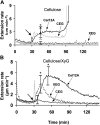
Wall extension induced by family-12 endoglucanases. These curves are averages of six to 19 responses. Arrows indicate when enzyme was added; the spike at this point is a mechanical artifact due to buffer exchange. No enzyme was added in the control. A, Wall creep induced by Cel12A (0.1 μg mL−1; 13 ≤ n ≤ 15). B, Wall creep was not induced by XEG or CEG (each 100 μg mL−1; 13 ≤ n ≤ 19). C, Wall creep was not induced by XEG + CEG mixtures (8 ≤ n ≤ 11). D, Wall extension induced by Cel12A (0.1 μg mL−1) alone and by Cel12A (0.1 μg mL−1) + CEG (10 μg mL−1; n = 6). Error bars show 95% confidence intervals. * P < 0.05 in t test comparison of means at selected time points.
Figure 4.
Figure 4.
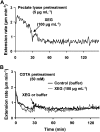
Wall-creep responses to XEG are not sensitized by pectin-disrupting pretreatments. A, Walls predigested with pectate lyase (initial 30 min) followed by XEG (mean of 10 curves). B, Walls preincubated in 50 mm CDTA (pH 6.5) for the first 30 min followed by XEG (average of 12 responses). The control included CDTA pretreatment but not XEG.
Figure 5.
Figure 5.
Wall-creep responses to family-5 and family-12 endoglucanases (means of eight to 10 responses). PpXG5 and BlXG12 have both cellulase and xyloglucanase activities, whereas AnXEG (family 12) has xyloglucanase but not cellulase activity. The solid arrow indicates when the enzymes (30 μg mL−1) were added. Error bars show 95% confidence intervals (for AnXEG, the bar is smaller than the line width). * P < 0.05 by Student’s two-tailed t test for difference before and after enzyme treatment.
Figure 6.
Figure 6.
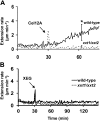
Creep responses of etiolated Arabidopsis wild-type (ecotype Columbia) and XyG-deficient mutant (xxt1/xxt2) hypocotyl walls to Cel12A and XEG treatment (average values of seven to eight responses). A, Creep responses to Cel12A. The arrow indicates when Cel12A (1 μg mL−1) was added. Error bars show 95% confidence intervals. * P < 0.05 for t test comparison of the two treatments at the time indicated. B, Creep responses to XEG. The arrow indicates when XEG (10 μg mL−1) was added.
Figure 7.
Figure 7.
Alteration of wall compliance by family-12 enzyme treatment. Error bars show 95% confidence intervals (10 ≤ n ≤ 12). * P < 0.05 by Student’s two-tailed t test for difference from buffer control.
Figure 8.
Figure 8.
Creep responses of bacterial cellulose and cellulose/XyG composites to family-12 enzymes (average values of eight to 10 responses). Solid arrows indicate when enzymes were added. A, Creep induced in bacterial cellulose pellicle by Cel12A (3 μg mL−1), XEG (100 μg mL−1), and CEG (30 μg mL−1) in 20 mm sodium acetate (pH 5.0) with 15 g of force. Error bars show 95% confidence intervals. * P < 0.05 by Student’s two-tailed t test for before and after enzyme treatment. For Ce112A and CEG treatments, half the samples broke at approximately 90 to 120 min, while the other half continued to creep at diminished rates. B, Creep of cellulose-XyG composite in response to Cel12A (3 μg mL−1), XEG (100 μg mL−1), and CEG (100 μg mL−1) in 20 mm sodium acetate (pH 5.0) with 7.5 g of force. Error bars show 95% confidence intervals. * P < 0.05 by Student’s two-tailed t test for before and after enzyme treatment.
Figure 9.
Figure 9.
Dionex HPLC analysis of XGOs of cucumber hypocotyls released by Cel12A and XEG. A, HPLC profiles of XGOs released by Cel12A and XEG (10 μg mL−1). B, Total XGOs released as a function of Cel12A and XEG concentration. Error bars show 95% confidence intervals (n = 2). C, Plot of peak wall extension rate against total XGOs released. Error bars show 95% confidence intervals (HPLC, n = 2; wall extension assay, 10 ≤ n ≤ 19). D, Amount of XGOs released by XEG or Cel12A following exhaustive predigestion with the other enzyme. Values are given for release by the second enzyme treatment. Error bars show 95% confidence intervals (n = 2). * P < 0.05 by Student’s two-tailed t test for difference between means.
Figure 10.
Figure 10.
Revised cartoon of primary cell wall architecture. A, The thick rods represent cellulose microfibrils, and the thin lines are XyGs. The load-bearing XyGs are represented as broken lines between microfibrils and are highlighted by the gray circles. They may act as a molecular binder to connect two adjacent microfibrils that are in close contact. The other XyGs are not load bearing and are shown as solid lines. B, A closeup of the hypothetical load-bearing junctions, where XyG is depicted as intertwined with disordered surface glucans from two adjacent microfibrils (at left), effectively sticking the microfibrils together at this point. [See online article for color version of this figure.]

References

    1. Albersheim P, Darvill A, Roberts K, Sederoff R, Staehelin A. (2011) Plant Cell Walls, from Chemistry to Biology. Garland Science, New York, pp 227–272
    1. Anderson CT, Carroll A, Akhmetova L, Somerville C. (2010) Real-time imaging of cellulose reorientation during cell wall expansion in Arabidopsis roots. Plant Physiol 152: 787–796 - PMC - PubMed
    1. Baron-Epel O, Gharyal PK, Schindler M. (1988) Pectins as mediators of wall porosity in soybean cells. Planta 175: 389–395 - PubMed
    1. Bauer S, Vasu P, Persson S, Mort AJ, Somerville CR. (2006) Development and application of a suite of polysaccharide-degrading enzymes for analyzing plant cell walls. Proc Natl Acad Sci USA 103: 11417–11422 - PMC - PubMed
    1. Bootten TJ, Harris PJ, Melton LD, Newman RH. (2004) Solid-state 13C-NMR spectroscopy shows that the xyloglucans in the primary cell walls of mung bean (Vigna radiata L.) occur in different domains: a new model for xyloglucan-cellulose interactions in the cell wall. J Exp Bot 55: 571–583 - PubMed

Publication types

MeSH terms