Imaging of podocyte foot processes by fluorescence microscopy
- PMID: 22362911
- PMCID: PMC3338299
- DOI: 10.1681/ASN.2011100988
Imaging of podocyte foot processes by fluorescence microscopy
Abstract
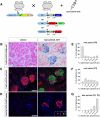
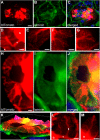
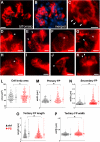
Visualizing podocyte foot processes requires electron microscopy, a technique that depends on special equipment, requires immunogold for colabeling, and does not take advantage of the growing number of in vivo fluorophores available. To address these limitations, we developed a genetic strategy to allow detailed visualization of single podocytes and their foot processes by conventional fluorescence microscopy. We generated a transgenic mouse line expressing a GFP-Cre-ERT2 fusion protein under the control of the collagen α1(I) promoter with strong podocyte expression. Administration of submaximal tamoxifen allowed genetic labeling of single podocytes when crossed with a Cre-reporter line. Of three different reporter systems that we evaluated for the ability to reveal fine structural details of podocytes, bigenic Coll1α1GCE;Gt(ROSA)26Sor(tm9(CAG-tdTomato)) mice allowed podocyte labeling with a strong and homogeneous reporter signal that was easily observed by epifluorescence. We could easily detect anatomic features of podocytes down to tertiary foot processes, and we were able to visualize and quantitate ultrastructural changes to foot processes after podocyte injury. In summary, using this method of genetic labeling and conventional fluorescence microscopy to visualize podocyte foot processes will complement electron microscopy and facilitate the analysis of podocytes and their precursors in vivo.
Figures


Similar articles
-
Light microscopic visualization of podocyte ultrastructure demonstrates oscillating glomerular contractions.Am J Pathol. 2013 Feb;182(2):332-8. doi: 10.1016/j.ajpath.2012.11.002. Epub 2012 Dec 13. Am J Pathol. 2013. PMID: 23246153
-
Construction of a viral T2A-peptide based knock-in mouse model for enhanced Cre recombinase activity and fluorescent labeling of podocytes.Kidney Int. 2017 Jun;91(6):1510-1517. doi: 10.1016/j.kint.2016.12.011. Epub 2017 Feb 7. Kidney Int. 2017. PMID: 28187984
-
Similar Biophysical Abnormalities in Glomeruli and Podocytes from Two Distinct Models.J Am Soc Nephrol. 2018 May;29(5):1501-1512. doi: 10.1681/ASN.2017050475. Epub 2018 Mar 23. J Am Soc Nephrol. 2018. PMID: 29572404 Free PMC article.
-
Novel Microscopic Techniques for Podocyte Research.Front Endocrinol (Lausanne). 2018 Jul 11;9:379. doi: 10.3389/fendo.2018.00379. eCollection 2018. Front Endocrinol (Lausanne). 2018. PMID: 30050501 Free PMC article. Review.
-
A High-Content Screening Technology for Quantitatively Studying Podocyte Dynamics.Adv Chronic Kidney Dis. 2017 May;24(3):183-188. doi: 10.1053/j.ackd.2017.04.001. Adv Chronic Kidney Dis. 2017. PMID: 28501082 Free PMC article. Review.
Cited by
-
Novel in vivo techniques to visualize kidney anatomy and function.Kidney Int. 2015 Jul;88(1):44-51. doi: 10.1038/ki.2015.65. Epub 2015 Mar 4. Kidney Int. 2015. PMID: 25738253 Free PMC article. Review.
-
Translational profiles of medullary myofibroblasts during kidney fibrosis.J Am Soc Nephrol. 2014 Sep;25(9):1979-90. doi: 10.1681/ASN.2013101143. Epub 2014 Mar 20. J Am Soc Nephrol. 2014. PMID: 24652793 Free PMC article.
-
Intravital imaging of podocyte calcium in glomerular injury and disease.J Clin Invest. 2014 May;124(5):2050-8. doi: 10.1172/JCI71702. Epub 2014 Apr 8. J Clin Invest. 2014. PMID: 24713653 Free PMC article.
-
Differentiated kidney epithelial cells repair injured proximal tubule.Proc Natl Acad Sci U S A. 2014 Jan 28;111(4):1527-32. doi: 10.1073/pnas.1310653110. Epub 2013 Oct 14. Proc Natl Acad Sci U S A. 2014. PMID: 24127583 Free PMC article.
-
Comparative Analysis of Podocyte Foot Process Morphology in Three Species by 3D Super-Resolution Microscopy.Front Med (Lausanne). 2018 Oct 30;5:292. doi: 10.3389/fmed.2018.00292. eCollection 2018. Front Med (Lausanne). 2018. PMID: 30425988 Free PMC article.
References
-
- Wiggins RC: The spectrum of podocytopathies: A unifying view of glomerular diseases. Kidney Int 71: 1205–1214, 2007 - PubMed
-
- Shirato I: Podocyte process effacement in vivo. Microsc Res Tech 57: 241–246, 2002 - PubMed
-
- Andrews P: Morphological alterations of the glomerular (visceral) epithelium in response to pathological and experimental situations. J Electron Microsc Tech 9: 115–144, 1988 - PubMed
Publication types
MeSH terms
Substances
Grants and funding
LinkOut - more resources
Full Text Sources
Miscellaneous

