. 2012 Feb;10(2):e1001262.
doi: 10.1371/journal.pbio.1001262. Epub 2012 Feb 21.

Facilitation of AMPA receptor synaptic delivery as a molecular mechanism for cognitive enhancement

Affiliations

Facilitation of AMPA receptor synaptic delivery as a molecular mechanism for cognitive enhancement

Shira Knafo et al. PLoS Biol. 2012 Feb.

Abstract

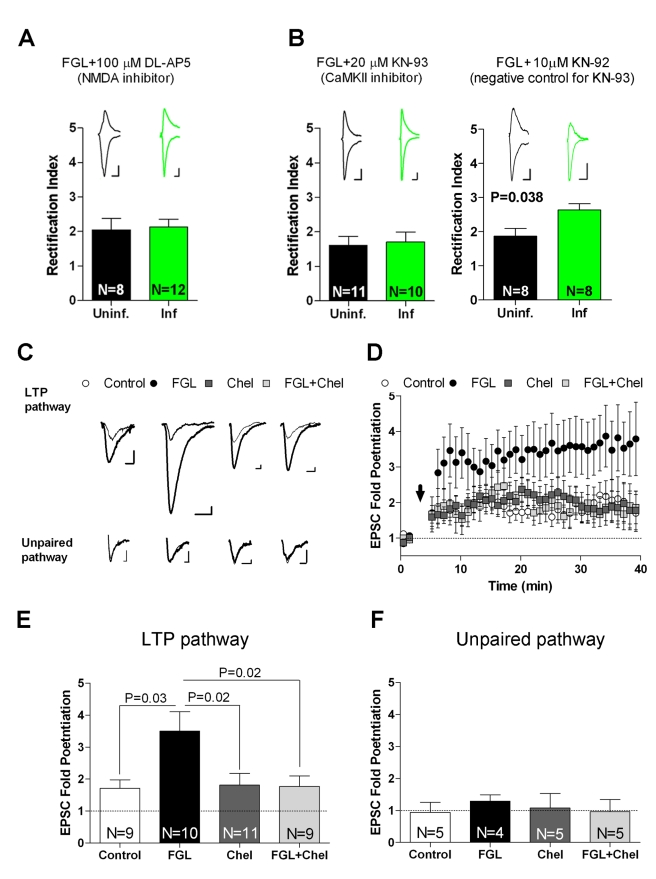
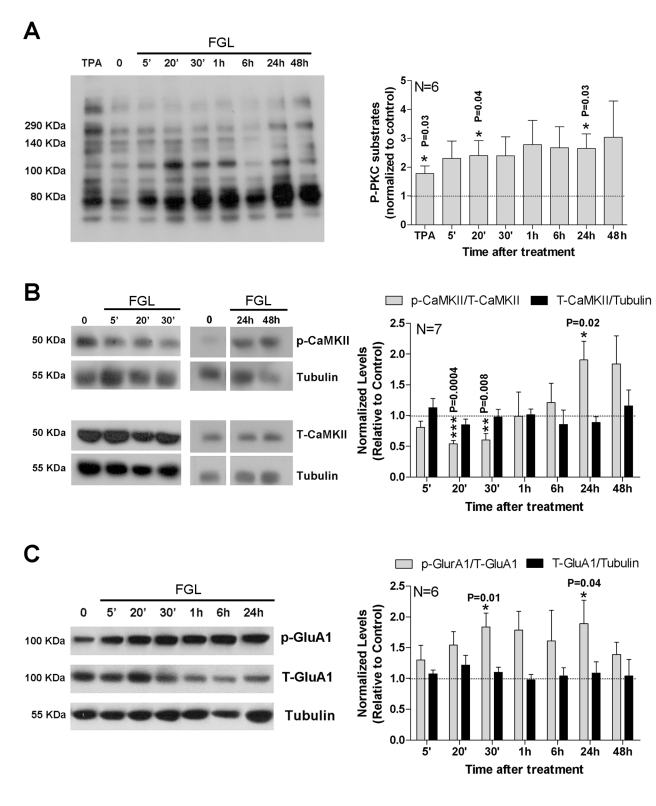
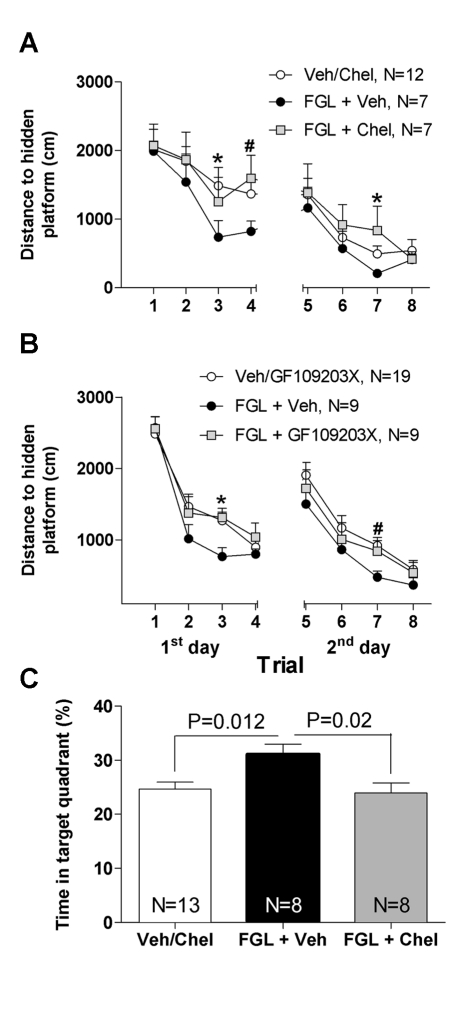
Cell adhesion molecules and downstream growth factor-dependent signaling are critical for brain development and synaptic plasticity, and they have been linked to cognitive function in adult animals. We have previously developed a mimetic peptide (FGL) from the neural cell adhesion molecule (NCAM) that enhances spatial learning and memory in rats. We have now investigated the cellular and molecular basis of this cognitive enhancement, using biochemical, morphological, electrophysiological, and behavioral analyses. We have found that FGL triggers a long-lasting enhancement of synaptic transmission in hippocampal CA1 neurons. This effect is mediated by a facilitated synaptic delivery of AMPA receptors, which is accompanied by enhanced NMDA receptor-dependent long-term potentiation (LTP). Both LTP and cognitive enhancement are mediated by an initial PKC activation, which is followed by persistent CaMKII activation. These results provide a mechanistic link between facilitation of AMPA receptor synaptic delivery and improved hippocampal-dependent learning, induced by a pharmacological cognitive enhancer.


Conflict of interest statement

I have read the journal's policy and have the following conflicts. E. Bock and V. Berezin are shareholders of ENKAM Pharmaceuticals A/S, which owns the FGL peptide (less than 0.01% shares each). Nevertheless, this does not alter our adherence to all the PLoS Biology policies on sharing data and materials.

Figures

Figure 1
Figure 1. FGL triggers hippocampal FGFR1 phosphorylation in vitro and in vivo.
(A) Cartoon structure of the double fibronectin module (FN1+FN2) of human NCAM (Protein Data Bank number 2VKW). The FGL sequence is shown in red with the two glutamine residues critical for the binding to the FGF-receptor highlighted in magenta. (B) Top: Representative immunoblot showing the in vitro phosphorylation of FGFR1 after stimulation of Trex293 cells that express Strep-tagged human FGFR1 with different concentrations of FGL and 10 ng/ml FGF1 (positive control) for 20 min. Bottom: Quantification of FGFR1 phosphorylation by FGL was performed by densitometric analysis of band intensity from four independent experiments similar to the one shown in the upper panel. (C) Phosphorylation of FGFR1 and TrkB was examined from hippocampal homogenates with an enzyme-linked immunosorbent assay (ELISA) 1 h after FGL subcutaneous injection. N, number of animals. Results are expressed as percentage ± SEM, with untreated controls set at 0%. (D–F) Phosphorylation of PLCγ (D), Shc (E), and FRS2 (F) in vitro was examined by Western blot, as described in Figure 1B. Treatment with FGF1 served as the positive control. Results from four independent experiments are expressed as a percentage ± SEM, with untreated controls set at 100%. *p<0.05, **p<0.01, ***p<0.001 compared with controls. Statistics were carried out according to the t test.
Figure 2
Figure 2. FGL enhances spatial learning.
(A) Mean distances swam to find the hidden platform in the Morris water maze are represented for control rats (white symbols) and FGL-treated rats (black symbols) over 2 training days (four trials each). N, number of animals. Statistical significance was analyzed with repeated-measures ANOVA. (B) Cumulative frequency distributions of the distances swam by individual rats. Each data point represents the distance swam by one rat in the last trial of each day.
Figure 3
Figure 3. Unchanged morphological parameters after FGL treatment.
(A) Fluorescence image of CA1 pyramidal neuron injected with Lucifer Yellow (green). DAPI nuclear staining (blue) was used to facilitate intracellular injection into the soma. Bar = 50 µm. (B) Confocal projection image of CA1 pyramidal neurons (left) and the same neuron processed for DAB staining (right). Bar = 20 µm. (C) High-magnification images of representative spiny dendrites. Bar = 10 µm. (D) Quantification of spine density from stratum radiatum CA1 dendrites. N, number of animals. (E) Quantification of spine density sorted by branch order (1–4) of the oblique apical dendrite. (F) Maximum-projection confocal images of a basal CA1 dendritic segment before (left) and after (right) the blind deconvolution protocol (10 iterations). Bar = 1 µm. (G) Maximum-projection image of a dendrite after blind deconvolution (left) and the same dendritic segment with marked spine heads (red) as used to measure head volumes (right). Bar = 2 µm. (H) Higher magnification of a short dendritic segment that shows the measurements of each spine (i.e., spine head volume and neck length). Bar = 0.5 µm. (I) Quantification of spine head volume in FGL and control rats. N, number of animals. (J) Cumulative frequency of spine head volume from the same data as in (I). N, number of spines. (K) Electron micrographs that show a representative neuropil in the stratum radiatum. Symmetric and asymmetric synapses were identified to quantify synaptic density using unbiased stereology. Bar = 0.5 µm. (L) Quantification of synaptic density in FGL and control rats. N, the number of animals. (M) Cumulative frequency of postsynaptic density length. N, number of synaptic profiles.
Figure 4
Figure 4. Enhanced postsynaptic excitatory transmission in neurons treated with FGL.
(A) Average AMPA/NMDA ratios for treated and untreated cells. AMPAR-mediated responses were recorded at −60 mV, and NMDAR-mediated responses were recorded at +40 mV. The p value was determined using the Mann-Whitney test. (B) Average AMPA/GABA ratios for treated and untreated cells. AMPAR-mediated responses were recorded at −60 mV, and GABA-mediated responses were recorded at +0 mV. NMDAR were blocked with DL-AP5. The p value was determined using a t test. Representative traces appear above the corresponding bars. N, number of cells. (C) Average NMDA/GABA ratios for treated and untreated cells. NMDAR-mediated responses were recorded at −60 mV in the absence of Mg2+ and in the presence of CNQX to block AMPARs. GABA-mediated responses were recorded at 0 mV. The p value was determined using a t test. Representative traces appear above the corresponding bars. N, number of cells. (D) Paired-pulse facilitation (PPF) in FGL and control neurons. The values denote the ratio of the second EPSC amplitude to the first EPSC amplitude. PPF was tested for 50-, 100-, 200-, and 400-ms interstimulus intervals. Insets. Sample trace of evoked AMPAR-mediated synaptic responses with an interstimulus interval of 50 ms. N, number of cells. Scale bars: 10 pA, 50 ms.
Figure 5
Figure 5. FGL induces AMPA receptor synaptic delivery via PKC activation.
(A) Left: CA1 pyramidal neurons that express GluA1-GFP (green) on a DAPI-stained (blue) organotypic slice culture, imaged with laser-scanning confocal microscopy. Bar = 50 µm. Right: High-magnification image of GluA1-GFP-expressing neurons. Bar = 20 µm. (B) Schematic diagram that presents whole-cell recordings obtained from a neuron expressing GluA1-GFP (infected, green) and an adjacent non-fluorescent (uninfected, white) neuron. (C) AMPAR-mediated responses were recorded at −60 mV and +40 mV. The rectification index was calculated as the ratio of responses at these holding potentials. The p value was determined using the Mann-Whitney test. (D–H) FGL-induced rectification after incubation with inhibitors of different signal transduction pathways: MEK, PD98059 (D); PI3K, LY294002 (E); PKC, chelerythrine (F); classical PKC isoforms, GF109203X (G); atypical PKC isoforms (H). Sample traces are shown above the corresponding columns of the plot. N, number of cells. The p value was determined using the Mann-Whitney test. Scale bars = 15 pA and 10 ms.
Figure 6
Figure 6. FGL enhances long-term synaptic potentiation.
(A–B) Rectification experiments similar to the ones described in Figure 5, after incubation with DL-AP5 (NMDAR inhibitor), KN-93 (CaMKII inhibitor), or KN-92 (inactive analog of KN-93). Sample traces are shown above the graphs. (C) Sample traces of evoked AMPAR-mediated synaptic responses recorded from CA1 neurons at −60 mV before (thin line) and after (thick line) LTP induction. LTP was induced by pairing presynaptic 3 Hz stimulation (540 pulses) with postsynaptic depolarization (0 mV). One of the stimulating electrodes was turned off during LTP induction (“unpaired pathway”). Organotypic slice cultures were incubated with (i) normal culture medium (control), (ii) FGL, (iii) the PKC inhibitor chelerythrine (Chel), or (iv) FGL and chelerythrine (FGL+Chel), as indicated. Treatments were for 24 h and slices were transferred to fresh culture medium (without FGL or chelerythine) for an additional 24 h prior to recordings. (D) Time course of normalized AMPAR-mediated synaptic responses before and after LTP induction (black arrow), from the slices treated as in (C). For simplicity, each time point in the plot corresponds to the average of 12 consecutive stimulations (sampling rate: 0.2 Hz). (E–F) Quantification of average synaptic potentiation from paired (“LTP”) and unpaired pathways from the last 10 min of the time-course shown in (D). The p value was determined with the Mann-Whitney test. N, number of cells.
Figure 7
Figure 7. FGL-triggered persistent activation of signaling pathways.
(A) Left: Western blot of hippocampal extracts treated with TPA (12-O-tetradecanoylphorbol-13-acetate; PKC activator that served as a positive control), untreated (“0”), and treated with FGL at different time-points after FGL application. The primary antibody detects phosphorylation of endogenous proteins at PKC substrate motifs (phospho-(Ser) PKC substrate). Right: Quantification of Western blots similar to the one shown on the left, by calculating the combined intensity from all bands in each lane. N, number of independent experiments. The p values were determined with the Mann-Whitney test. (B, C) Left: Western blot of hippocampal extracts treated with FGL at different time-points after FGL application and untreated (“0”). The primary antibodies detected phosphorylated CaMKII at Thr286 (p-CaMKII) and total levels of CaMKII (T-CaMKII) (B), or phospho-GluA1 (P-S831) and total GluA1 (C). Tubulin was used as a loading control. Right: Quantification of Western blots similar to the ones shown on the left. N, number of independent experiments. The p values were determined using the Mann-Whitney test.
Figure 8
Figure 8. FGL-induced enhanced cognition depends on PKC activity.
(A, B) Mean distances traveled to find the hidden platform in the Morris water maze are represented for control rats (white circles), FGL-treated rats (black circles), and rats treated with FGL and the PKC inhibitor (grey squares; A, chelerythrine; B, GF109203X), over the 2 training days (four trials each). N, number of animals. Statistical significance was analyzed with repeated-measures ANOVA followed by Bonferroni's post hoc test for individual trials. A: *p<0.05, FGL+Veh compared to FGL+Chel and Veh/Chel groups. #p<0.05, FGL+Veh compared to FGL+Chel but not compared to Veh/Chel. B: *p<0.05, FGL+Veh compared to FGL+GF109203X and Veh/GF109203X groups. #p<0.05, FGL+Veh compared to Veh/GF109203X but not compared to FGL+GF109203X. (C) Probe test. Average time spent in the target quadrant of the Morris water maze (where the hidden platform had been present during training) for control rats (white column), FGL-treated rats (black column), or rats treated with FGL plus chelerythrine (grey column). Statistical significance was calculated with Bonferroni's post hoc test.

Similar articles

Cited by

References

    1. Bliss T. V, Collingridge G. L. A synaptic model of memory: long-term potentiation in the hippocampus. Nature. 1993;361:31–39. - PubMed
    1. Tang Y. P, Shimizu E, Dube G. R, Rampon C, Kerchner G. A, et al. Genetic enhancement of learning and memory in mice. Nature. 1999;401:63–69. - PubMed
    1. Lee Y. S, Silva A. J. The molecular and cellular biology of enhanced cognition. Nat Rev Neurosci. 2009;10:126–140. - PMC - PubMed
    1. Washbourne P, Dityatev A, Scheiffele P, Biederer T, Weiner J. A, et al. Cell adhesion molecules in synapse formation. J Neurosci. 2004;24:9244–9249. - PMC - PubMed
    1. Doherty P, Fazeli M. S, Walsh F. S. The neural cell adhesion molecule and synaptic plasticity. J Neurobiol. 1995;26:437–446. - PubMed

Publication types

MeSH terms

Substances