Comparative Study
. 2012 Feb;10(2):e1001266.
doi: 10.1371/journal.pbio.1001266. Epub 2012 Feb 21.

Neural mechanisms underlying motivation of mental versus physical effort

Affiliations
Comparative Study

Neural mechanisms underlying motivation of mental versus physical effort

Liane Schmidt et al. PLoS Biol. 2012 Feb.

Abstract

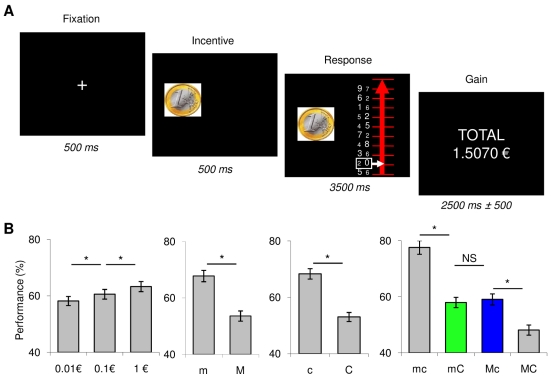
Mental and physical efforts, such as paying attention and lifting weights, have been shown to involve different brain systems. These cognitive and motor systems, respectively, include cortical networks (prefronto-parietal and precentral regions) as well as subregions of the dorsal basal ganglia (caudate and putamen). Both systems appeared sensitive to incentive motivation: their activity increases when we work for higher rewards. Another brain system, including the ventral prefrontal cortex and the ventral basal ganglia, has been implicated in encoding expected rewards. How this motivational system drives the cognitive and motor systems remains poorly understood. More specifically, it is unclear whether cognitive and motor systems can be driven by a common motivational center or if they are driven by distinct, dedicated motivational modules. To address this issue, we used functional MRI to scan healthy participants while performing a task in which incentive motivation, cognitive, and motor demands were varied independently. We reasoned that a common motivational node should (1) represent the reward expected from effort exertion, (2) correlate with the performance attained, and (3) switch effective connectivity between cognitive and motor regions depending on task demand. The ventral striatum fulfilled all three criteria and therefore qualified as a common motivational node capable of driving both cognitive and motor regions of the dorsal striatum. Thus, we suggest that the interaction between a common motivational system and the different task-specific systems underpinning behavioral performance might occur within the basal ganglia.


Conflict of interest statement

The authors have declared that no competing interests exist.

Figures

Figure 1
Figure 1. Behavioral task and results.
(A) Example of task trial. Successive screenshots displayed are shown from left to right with durations in ms. Every trial started with a central fixation cross. Then the monetary incentive (0.01, 0.1, or 1€) was displayed as a coin image and effort was triggered by the onset of a graduated line representing a ladder. The goal was to move the white cursor up as high as possible, each step representing 10% of the money at stake. To reach the next step participants had to squeeze the handgrip on the side of the numerically greater figure in the white box. In congruent pairs this figure was also the greater physically (font size), whereas it was physically smaller in incongruent pairs. The motor demand was manipulated by changing the amount of force needed to reach the next step (30% versus 60% of the maximal force in easy versus hard trials). The cognitive demand was manipulated by changing the proportion of congruent pairs (100% versus 50% in easy versus hard trials). At the end of every trial the cumulative total of monetary earnings was displayed on the screen. (B) Performance across experimental conditions. Performance is expressed as the percentage of the monetary incentive reached (i.e., of steps completed on the ladder). Bars represent the average performance ± inter-participant standard error for the three monetary incentives (0.01, 0.1, and 1€) and the four effort conditions (m, easy motor effort; M, hard motor effort; c, easy cognitive effort; C, hard cognitive effort). * Significant difference (two-tailed paired t test, p<0.05); ns, non-significant.
Figure 2
Figure 2. Neural correlates of main experimental factors and effects (reward level, cognitive and motor demands, and performance level).
(A) Statistical parametric maps (SPM) show the main parametric modulation effects obtained with GLM1. (B) SPM shows the conjunction between expected reward and performance level modulation effects. Voxels displayed in grey-black on the glass brains survived a threshold of p<0.05 after voxel-wise correction for multiple comparisons (family-wise error, FWE). Frontal slices were taken at the maxima of interest indicated by blue lines on glass brains and superimposed on the average structural scan. Voxels displayed in yellow on slices survived a threshold of p<0.001 (uncorrected) after cluster-wise FWE correction for multiple comparisons. The [x y z] coordinates of maxima refer to the Montreal Neurological Institute (MNI) space.
Figure 3
Figure 3. Neural correlates of performance effects depending on effort type (motor or cognitive demand).
(A) SPM show activations obtained with GLM2 for the contrast between high and low incentives, the correlation with performance levels, and the conjunction between these two effects. (B) SPM shows regions parametrically modulated by performance level during both motor and cognitive effort (conjunction of mC and Mc conditions). (C) Graphs show regression coefficients (betas) obtained in the ventral striatum (VS) for the parametric modulation by performance levels during effort exertion in mC and Mc conditions, separately. Bars represent mean ± inter-participant standard errors. Dotted line indicates non-significant (NS) difference (two-tailed paired t test, p>0.05). (D) Scatter plots illustrate the inter-participant correlation between behavioral and neural incentive effects (1€ versus 1c). Solid line represents significant correlation (p<0.05).
Figure 4
Figure 4. Psychophysiological interaction (PPI) between ventral striatum activity and task demand.
SPMs show voxels in which activity was significantly correlated with left VS signal when the motor demand was high (top) and when the cognitive demand was high (bottom). Significant voxels (p<0.05, whole-brain voxel-wise FWE correction) are displayed in grey-black on glass brains and in orange-yellow on axial slices. Slices were taken at the peaks located in the left caudate for cognitive effort and in the left putamen for motor effort. Activations are superimposed on the average structural brain scan. The [x y z] coordinates refer to the Montreal Neurological Institute (MNI) space.
Figure 5
Figure 5. Dynamic causal modeling (DCM) analysis optimizing the connectivity structure of the striatal network.
In all illustrated models, the driving inputs were boxcar functions over effort exertion periods (Eff) for the caudate (Cd) and putamen (Pt) and over incentive display plus effort exertion modulated by expected reward (Rew) for the ventral striatum (VS). From left to right, connections were systematically added up to a fully connected network. From top to bottom: the locus of parametric modulation by cognitive (Cog) and motor (Mot) task demand was varied. Graphs illustrate the result of a Bayesian model selection (BMS) procedure used to find the most likely model.
Figure 6
Figure 6. Dynamic causal modeling (DCM) analysis confronting our best model to alternative hypotheses.
Model a is the winner of the previous Bayesian model selection (i.e., model B1 in Figure 5). Model b reversed the direction of links impacted by task demand modulatory, now going from caudate and putamen to the VS. Model c changed the loci of task demand modulatory effects, now affecting directly VS activity instead of connectivity. VS, ventral striatum; Cd, caudate nucleus; Pt, putamen; Rew, expected reward; Eff, effort exertion; Cog, cognitive demand; Mot, motor demand. Graphs illustrate the result of a Bayesian model selection (BMS) procedure, showing the exceedance probability of each model.

Similar articles

Cited by

References

    1. Berridge K. C. Motivation concepts in behavioral neuroscience. Physiol Behav. 2004;81:179–209. - PubMed
    1. Small D. M, Gitelman D, Simmons K, Bloise S. M, Parrish T, et al. Monetary incentives enhance processing in brain regions mediating top-down control of attention. Cereb Cortex. 2005;15:1855–1865. - PubMed
    1. Kouneiher F, Charron S, Koechlin E. Motivation and cognitive control in the human prefrontal cortex. Nat Neurosci. 2009;12:939–945. - PubMed
    1. Krawczyk D. C, Gazzaley A, D'Esposito M. Reward modulation of prefrontal and visual association cortex during an incentive working memory task. Brain Res. 2007;1141:168–177. - PubMed
    1. Pochon J. B, Levy R, Fossati P, Lehericy S, Poline J. B, et al. The neural system that bridges reward and cognition in humans: an fMRI study. Proc Natl Acad Sci U S A. 2002;99:5669–5674. - PMC - PubMed

Publication types