Review
. 2011 Dec;9(12):2729-2772.
doi: 10.3390/md9122729. Epub 2011 Dec 16.

Cyanotoxins: bioaccumulation and effects on aquatic animals

Affiliations
Review

Cyanotoxins: bioaccumulation and effects on aquatic animals

Aloysio da S Ferrão-Filho et al. Mar Drugs. 2011 Dec.

Abstract

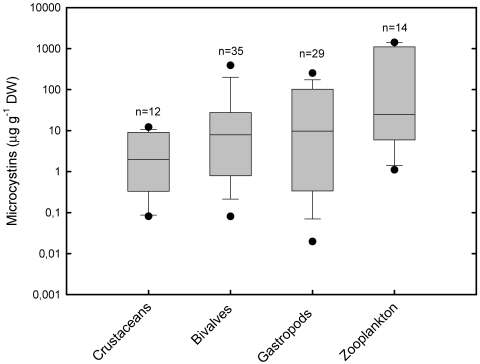
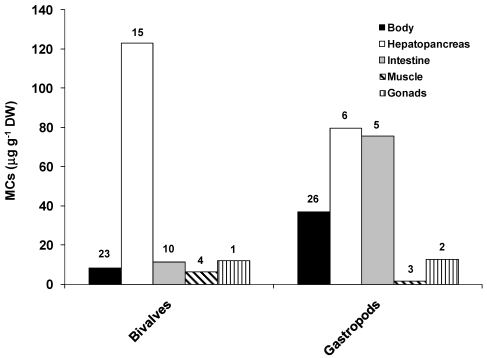
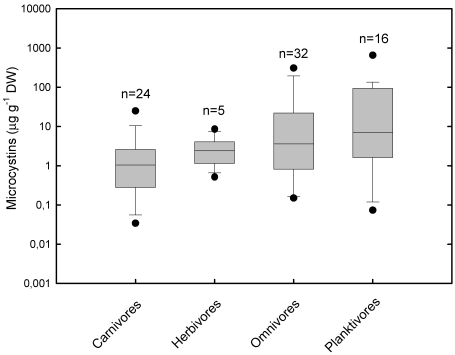
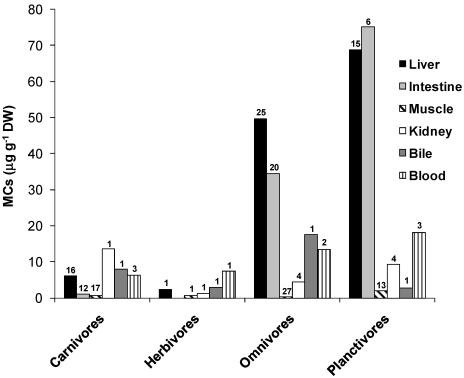
Cyanobacteria are photosynthetic prokaryotes with wide geographic distribution that can produce secondary metabolites named cyanotoxins. These toxins can be classified into three main types according to their mechanism of action in vertebrates: hepatotoxins, dermatotoxins and neurotoxins. Many studies on the effects of cyanobacteria and their toxins over a wide range of aquatic organisms, including invertebrates and vertebrates, have reported acute effects (e.g., reduction in survivorship, feeding inhibition, paralysis), chronic effects (e.g., reduction in growth and fecundity), biochemical alterations (e.g., activity of phosphatases, GST, AChE, proteases), and behavioral alterations. Research has also focused on the potential for bioaccumulation and transferring of these toxins through the food chain. Although the herbivorous zooplankton is hypothesized as the main target of cyanotoxins, there is not unquestionable evidence of the deleterious effects of cyanobacteria and their toxins on these organisms. Also, the low toxin burden in secondary consumers points towards biodilution of microcystins in the food web as the predominant process. In this broad review we discuss important issues on bioaccumulation and the effects of cyanotoxins, with emphasis on microcystins, as well as drawbacks and future needs in this field of research.

Keywords: bioaccumulation; cyanobacteria; cyanotoxins; invertebrates; vertebrates.


Figures

Figure 1
Figure 1
Concentration of hepatotoxins microcystins (MCs) (µg g−1 DW) in aquatic invertebrates. Box plots represent median, standard error, 5th and 95th percentile of maximum values found in each study, irrespective of organ/tissue. Black circles represent minimum and maximum values found. Data in crustaceans (Decapoda), bivalves and gastropods are maximum values found in the whole body or organ/tissue (e.g., stomach, liver, muscles, etc.), and values in zooplankton are maximum values in the whole body from natural communities or from experimental animals. Field and laboratory samples in the same study were considered as independent samples, regardless of the species. The number of samples (n) represents the number of data for each taxa. Data based in a total of 55 studies (not considering the data of Williams et al. (ref. 45 in Supplementary Table S1) with Limieux oxidation). Studies were carried out under natural exposure conditions (i.e., blooms or seston samples) or through exposure to cyanobacterial cultures.
Figure 2
Figure 2
Concentration of MCs (µg g−1 DW) in mollusks. Bars represent the mean of maximum values found in each organ/tissue. Numbers on top of bars represent the number of data (n) in each organ/tissue or whole body (Body). Data based in a total of 35 studies (20 for bivalves and 15 for gastropods). Studies were carried out under natural exposure conditions (i.e., blooms or seston samples) or through exposure to cyanobacterial cultures.
Figure 3
Figure 3
Concentration of MCs in fish by trophic guild. Box plots represent median, standard error, 5th and 95th percentile of maximum values found in each study, irrespective of organ/tissue. Black circles represent minimum and maximum values found. Field and laboratory samples in the same study were considered as independent samples, regardless of the species. The number of samples (n) represents the number of data in each guild. Data is based on a total of 28 studies. Studies were carried out in one of following conditions: natural conditions (blooms or seston samples), exposure to dissolved toxins or to experimental pellets containing toxic food or to cyanobacterial cultures. Unnatural exposure routes (e.g., force-feeding, i.p. injections) were not included.
Figure 4
Figure 4
Concentration of MCs (µg g-1DW) in fish organs/tissues by trophic guild. Bars represent the mean of maximum values found in each organ/tissue. Numbers on top of bars represent the number of data (n) in each organ/tissue. Data based in a total of 28 studies (12 for carnivores, 1 for herbivores, 19 for omnivores and 13 for planktivores). Studies were carried out in one of following conditions: natural conditions (blooms or seston samples), exposure to dissolved toxins or to experimental pellets containing toxic food or to cyanobacterial cultures. Unnatural exposure routes (e.g., force-feeding, i.p. injections) were not included.

References

    1. Whitton B.A., Potts M. Introduction to the Cyanobacteria. In: Whitton B.A., Potts M., editors. The Ecology of Cyanobacteria, Their Diversity in Time and Space. 1st. Kluwer Academic Plublishers; Dordrecht, The Netherlands: 2000. pp. 1–4.
    1. Carmichael W.W. Cyanobacteria secondary metabolites: The cyanotoxins. J. Appl. Bacteriol. 1992;72:445–459. - PubMed
    1. Chorus I., Bartram J. In: Toxic Cyanobacteria in Water. A Guide to Their Public Health Consequences, Monitoring and Management. 1st. Chorus I., Bartran J., editors. E & FN Spon; London, UK: 1999.
    1. Codd G.A., Bell S.G., Kaya K., Ward C.J., Beattie K.A., Metcalf J.S. Cyanobacterial toxins, exposure routes and human health. Eur. J. Phycol. 1999;34:405–415.
    1. Sivonen K. Cyanobacterial toxins and toxin production. Phycologia. 1996;190:267–275.