. 2012 Feb 21:6:6.
doi: 10.3389/fncir.2012.00006. eCollection 2012.

Experience-dependent firing rate remapping generates directional selectivity in hippocampal place cells

Affiliations

Experience-dependent firing rate remapping generates directional selectivity in hippocampal place cells

Zaneta Navratilova et al. Front Neural Circuits. .

Abstract

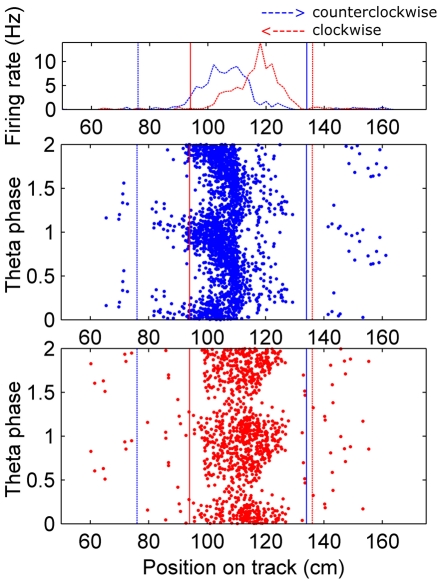
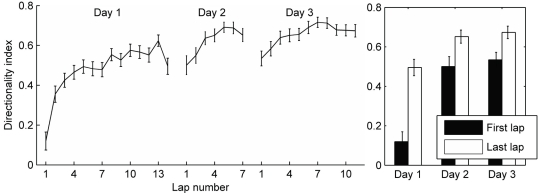
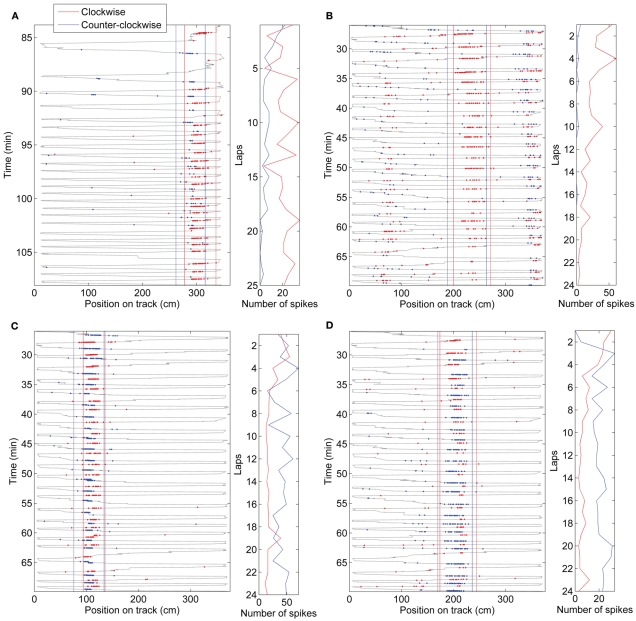
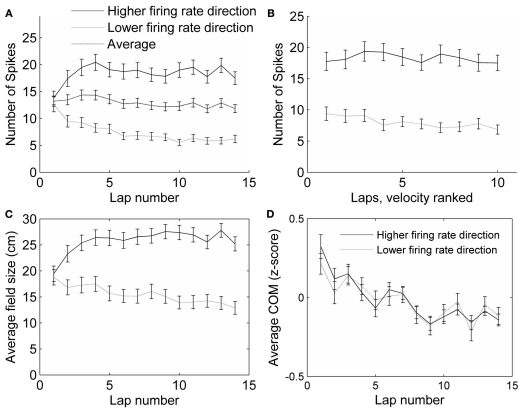
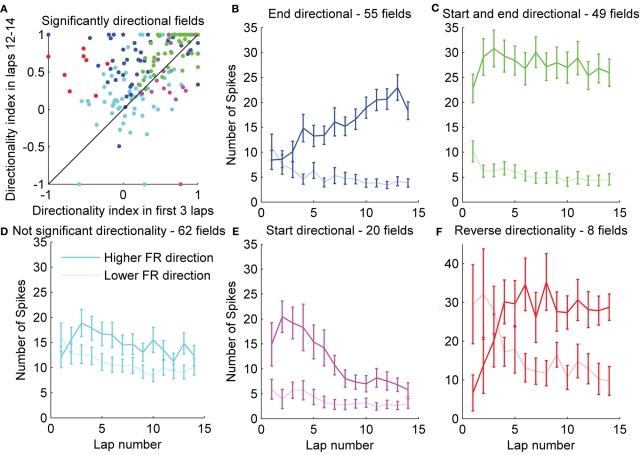
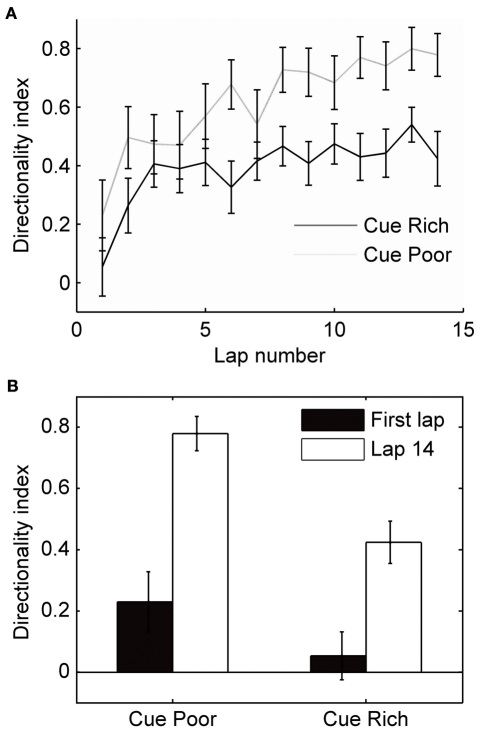
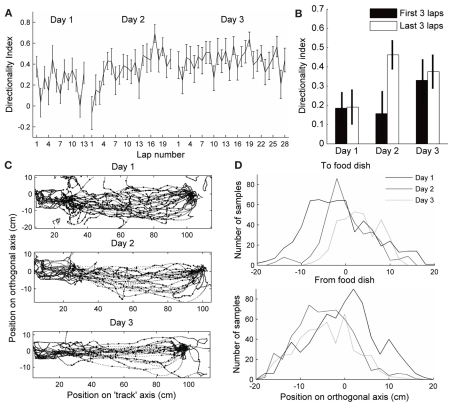
When rodents engage in irregular foraging in an open-field environment, hippocampal principal cells exhibit place-specific firing that is statistically independent of the direction of traverse through the place field. When the path is restricted to a track, however, in-field rates differ substantially in opposite directions. Frequently, the representations of the track in the two directions are essentially orthogonal. We show that this directionally selective firing is not hard-wired, but develops through experience-dependent plasticity. During the rats' first pass in each direction, place fields were highly directionally symmetric, whereas over subsequent laps, the firing rates in the two directions gradually but substantially diverged. We conclude that, even on a restricted track, place cell firing is initially determined by allocentric position, and only later, the within-field firing rates change in response to differential sensory information or behavioral cues in the two directions. In agreement with previous data, place fields near local cues, such as textures on the track, developed less directionality than place fields on a uniform part of the track, possibly because the local cues reduced the net difference in sensory input at a given point. Directionality also developed in an open environment without physical restriction of the animal's path, when rats learned to run along a specified path. In this case, directionality developed later than on the running track, only after the rats began to run in a stereotyped manner. Although the average population firing rates exhibited little if any change over laps in either direction, the direction-specific firing rates in a given place field were up-or down-regulated with about equal probability and magnitude, which was independent in the two directions, suggesting some form of competitive mechanism (e.g., LTP/LTD) acting coherently on the set of synapses conveying external information to each cell.

Keywords: CA1; CA3; directional place fields; navigation; path integration; rate remapping.


Figures

Figure 1
Figure 1
Assigning boundaries around fields. Top: Occupancy normalized firing rate for an example cell is plotted on the coordinates of the circular track (the barrier was at 0 cm, which wraps around to 361.3 cm, and the food dishes were near that, at ∼10 cm and 351 cm). The firing rate in the clockwise direction (right to left on this plot) is colored red, and the counter-clockwise direction is in blue. Fields were identified by an automated algorithm, which found peaks (in each direction separately) in the smoothed version of this plot, and set boundaries at the troughs around those peaks. If the majority of the field found in one direction overlapped with a field in the opposite direction the two fields were combined, and the spikes within the boundaries outlined in each direction were considered for further analysis. The boundaries were set separately for each direction to account for the shifting of fields in the backwards running direction. If a field did not overlap with one in the opposite direction, any spikes occurring in the same position bins were considered as the opposite direction field. Dotted vertical lines indicate the beginning and solid lines the end of the field. Bottom: All fields identified were visualized on a theta phase plot, to ensure they exhibited phase precession. Fields that did not show complete phase precession in at least one direction, overlapped with another field, or showed truncated phase precession because of overlap with a food dish location were eliminated from the analysis.
Figure 2
Figure 2
Development of directionality on a circular track. The number of spikes occurring within the field boundaries in each running direction was analyzed. The directionality index was calculated for each field on each lap as the difference in number of spikes fired in the preferred and non-preferred running directions divided by the total spikes in both directions (see Methods). The mean directionality index for all fields is plotted for each lap and each session. Error bars represent standard error of the mean. Laps are cut off at the least number of laps run by the four rats in a given session. Right: Comparing the directionality index during the first lap and the last lap in each session shows a significant increase from beginning to the end of each session.
Figure 3
Figure 3
Examples of firing rate changes in individual cells on day 1. (A) A proximal CA1 cell from rat 3 expressing a field on the cue-rich side of the track showed a typical pattern of directionality increase. Many cells (those falling in the category shown in Figure 5B) showed a directionality increase such as this. (B) Some cells expressed fields that started with significant directionality in the first few laps, such as the highlighted field of the intermediate CA1 cell shown here. Like this example, many cells in the category shown in Figure 5C increased their directionality even more after the first few laps. (C) An intermediate CA1 cell from rat 1 expressing a field on the cue-rich part of the track showed a small directionality increase. Many cells remained bi-directional throughout the session. (D) A few cells started directional and became less so, or reversed their preferred direction of firing (cells in the categories in Figure 5E,F). This intermediate CA1 cell from rat 1 didn't start firing until the return (clockwise) direction on the first lap, and then, over the next two laps, increased its firing rate in the counter-clockwise direction, eventually firing more spikes in that direction.
Figure 4
Figure 4
Control analyses. (A) The average number of spikes fired in all fields did not change with lap number, even though the firing rates in each direction did. (B) The number of spikes fired within a field decreased slightly with running speed, but not differentially for the two running directions. The average number of spikes fired on the slowest pass through each field, the next slowest, and so on until the fastest pass, was calculated. The first four laps were excluded from this analysis, because the running speed was highly correlated with lap number in these laps. The slowest passes through each field (excluding the first four laps) were on average 17.7 cm/s (SEM = 0.53), and the fastest passes were on average 31.0 cm/s (SEM = 0.75), covering a range of the same size to the range of the passes during laps 1–10. (C) Average field size (measured as the distance from the first spike to the last spike) changed in each running direction across laps by about 35%, but not as much as the number of spikes fired (A). (D) The center of mass (COM) of place fields shifted backwards, in both preferred (higher firing rate) and non-preferred (lower firing rate) directions.
Figure 5
Figure 5
Remapping in individual fields. (A) To observe the amount of rate remapping exhibited within individual fields, the directionality index during the first three laps was plotted against the directionality index during the last three laps. Significance of the directionality in individual fields was assessed with a χ2 test. Fields were classified based on whether they exhibited significant (p < 0.05) directionality at the beginning or end of the session or both, and are color-coded based on this classification. (B–F) For each group of fields, the average firing rates in each running direction are also displayed. Error bars represent standard error of the mean. Additionally, eight fields were identified that showed significant directionality in the non-preferred direction at the beginning of the session.
Figure 6
Figure 6
Local cues and the development of directionality. Half of the circular track was enriched with small objects and textures (local cues). (A) The mean directionality index is plotted for fields expressed on the cue-rich and cue-poor halves of the track. (B) During the first lap, field directionality on the cue-rich and cue-poor halves of the track did not differ significantly (t-test, p = 0.16). Over the session, fields on both parts of the track became significantly more directional (paired t-tests, p < 0.01); however, fields on the cue-rich part of the track increased directionality less than fields on the cue-poor side, and directionality was significantly different between regions on the last lap (t-test, p < 0.001).
Figure 7
Figure 7
Directionality in an open-field. (A–B) Directionality index in fields expressed on an open-field platform during performance of a shuttle task. Day 1 is the first day each rat ran more than 20 laps (This was actually day 2 in the environment for one rat, and day 4 for the other rat. On this day, rat 3 ran 22 laps, 13 of which were direct, and rat 4 ran 25, 20 of which were direct). The day after that, the rats ran 53 and 21 direct laps, respectively, and the directionality index started low and increased by laps 18–21. On the following day (3), the directionality index started as high as at the end of day 2, and did not change throughout the session. (B) Directionality index during the first three and last three laps of each session. (C) Paths run by one of the rats during the first 13 direct passes between the start box (left) and the food dish (right). The position was sampled five times per second, excluding the times when the rat was in the box or at the food dish, to test for variability (large dots). (D) Distribution of positions along the axis orthogonal to the direct path from food dish to box at the sampled times is plotted for both rats. Paths toward the food dish and away from the food dish are plotted separately. The distribution is wider on day 1 in both directions.

References

    1. Abraham W. C., Goddard G. V. (1983). Asymmetric relationships between homosynaptic long-term potentiation and heterosynaptic long-term depression. Nature 305, 717–719 - PubMed
    1. Barnes C. A., Suster M. S., Shen J., McNaughton B. L. (1997). Multistability of cognitive maps in the hippocampus of old rats. Nature 388, 272–275 10.1038/40859 - DOI - PubMed
    1. Battaglia F. P., Sutherland G. R., McNaughton B. L. (2004). Local sensory cues and place cell directionality: additional evidence of prospective coding in the hippocampus. J. Neurosci. 24, 4541–4550 10.1523/JNEUROSCI.4896-03.2004 - DOI - PMC - PubMed
    1. Berke J. D., Breck J. T., Eichenbaum H. (2009). Striatal versus hippocampal representations during win-stay maze performance. J. Neurophysiol. 101, 1575–1587 10.1152/jn.91106.2008 - DOI - PMC - PubMed
    1. Bower M. R., Euston D. R., McNaughton B. L. (2005). Sequential-context-dependent hippocampal activity is not necessary to learn sequences with repeated elements. J. Neurosci. 25, 1313–1323 10.1523/JNEUROSCI.2901-04.2005 - DOI - PMC - PubMed