

Patient-tailored connectomics visualization for the assessment of white matter atrophy in traumatic brain injury
- PMID: 22363313
- PMCID: PMC3275792
- DOI: 10.3389/fneur.2012.00010
Patient-tailored connectomics visualization for the assessment of white matter atrophy in traumatic brain injury
Abstract
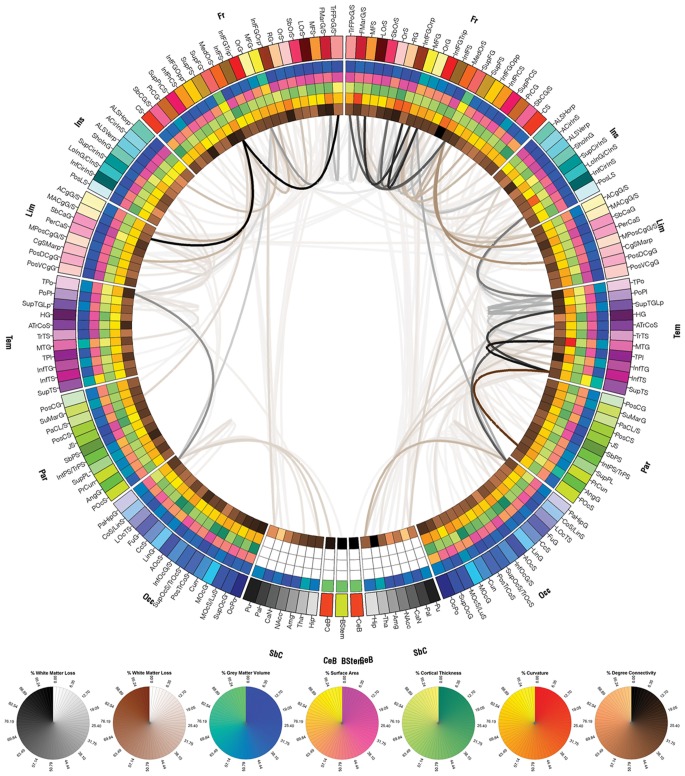
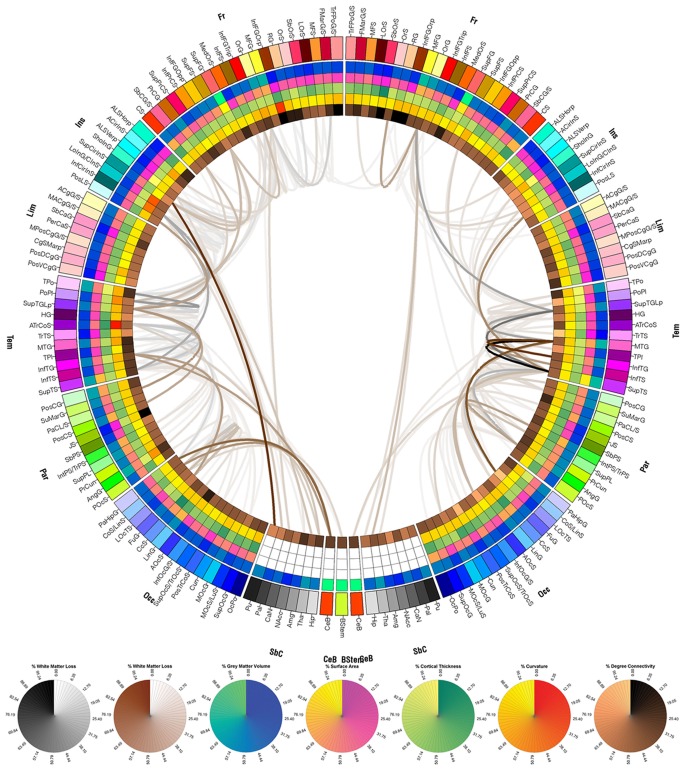
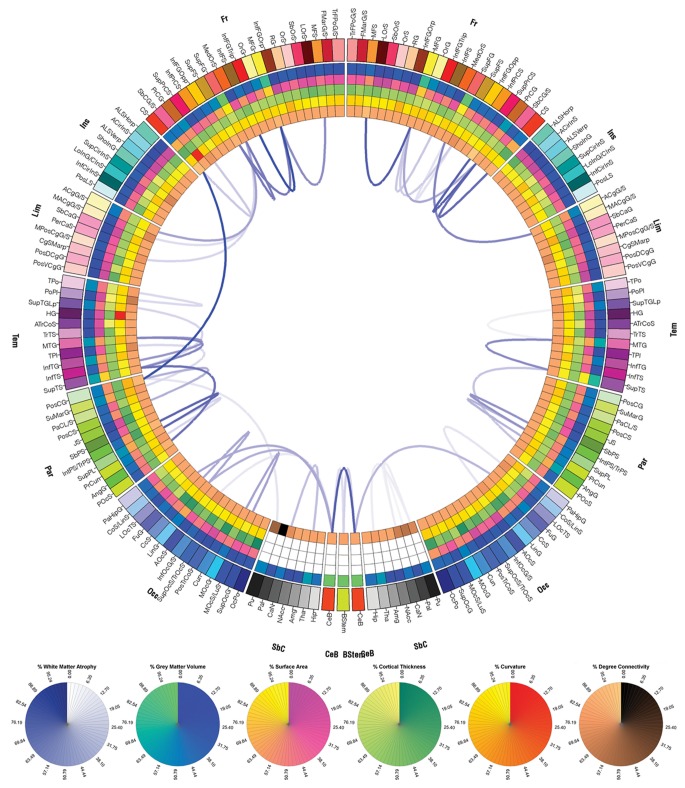
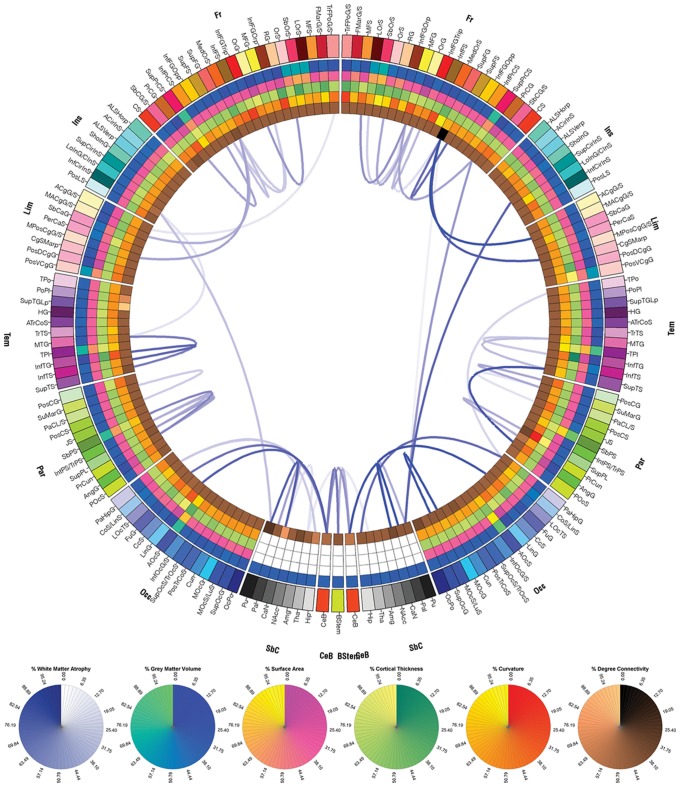
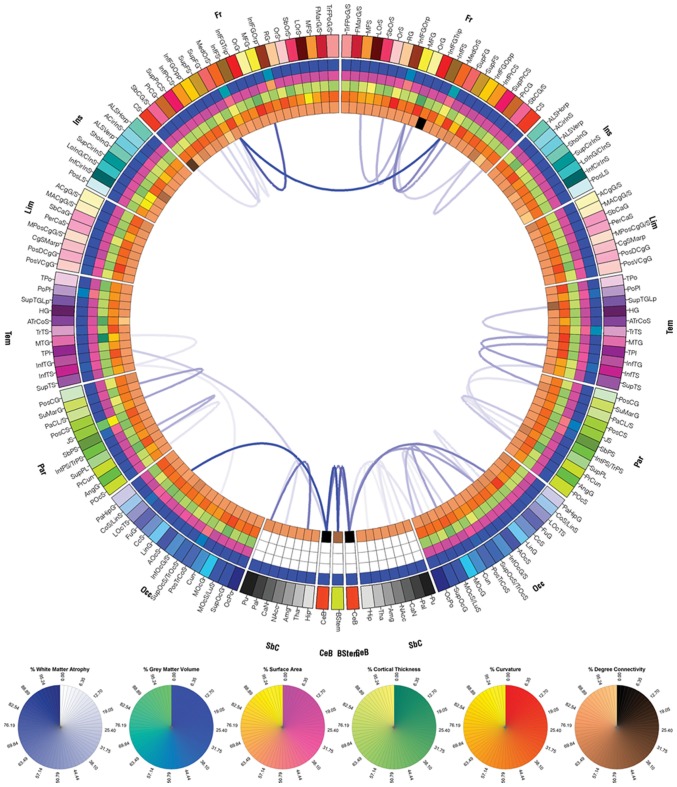
Available approaches to the investigation of traumatic brain injury (TBI) are frequently hampered, to some extent, by the unsatisfactory abilities of existing methodologies to efficiently define and represent affected structural connectivity and functional mechanisms underlying TBI-related pathology. In this paper, we describe a patient-tailored framework which allows mapping and characterization of TBI-related structural damage to the brain via multimodal neuroimaging and personalized connectomics. Specifically, we introduce a graphically driven approach for the assessment of trauma-related atrophy of white matter connections between cortical structures, with relevance to the quantification of TBI chronic case evolution. This approach allows one to inform the formulation of graphical neurophysiological and neuropsychological TBI profiles based on the particular structural deficits of the affected patient. In addition, it allows one to relate the findings supplied by our workflow to the existing body of research that focuses on the functional roles of the cortical structures being targeted. A graphical means for representing patient TBI status is relevant to the emerging field of personalized medicine and to the investigation of neural atrophy.
Keywords: DTI; atrophy; connectomics; rehabilitation; traumatic brain injury.
Figures
Similar articles
-
Traumatic Brain Injury as a Disorder of Brain Connectivity.J Int Neuropsychol Soc. 2016 Feb;22(2):120-37. doi: 10.1017/S1355617715000740. J Int Neuropsychol Soc. 2016. PMID: 26888612 Free PMC article. Review.
-
White matter integrity and cognition in chronic traumatic brain injury: a diffusion tensor imaging study.Brain. 2007 Oct;130(Pt 10):2508-19. doi: 10.1093/brain/awm216. Epub 2007 Sep 14. Brain. 2007. PMID: 17872928
-
Quantitative structural changes in white and gray matter 1 year following traumatic brain injury in rats.Acta Neuropathol. 2002 Jun;103(6):607-14. doi: 10.1007/s00401-001-0510-8. Epub 2002 Mar 20. Acta Neuropathol. 2002. PMID: 12012093
-
Statistical machine learning to identify traumatic brain injury (TBI) from structural disconnections of white matter networks.Neuroimage. 2016 Apr 1;129:247-259. doi: 10.1016/j.neuroimage.2016.01.056. Epub 2016 Jan 28. Neuroimage. 2016. PMID: 26827816
-
Neuroinformatics challenges to the structural, connectomic, functional and electrophysiological multimodal imaging of human traumatic brain injury.Front Neuroinform. 2014 Feb 26;8:19. doi: 10.3389/fninf.2014.00019. eCollection 2014. Front Neuroinform. 2014. PMID: 24616696 Free PMC article. Review.
Cited by
-
West Nile Virus Spreads Transsynaptically within the Pathways of Motor Control: Anatomical and Ultrastructural Mapping of Neuronal Virus Infection in the Primate Central Nervous System.PLoS Negl Trop Dis. 2016 Sep 12;10(9):e0004980. doi: 10.1371/journal.pntd.0004980. eCollection 2016 Sep. PLoS Negl Trop Dis. 2016. PMID: 27617450 Free PMC article.
-
Variational Bayesian causal connectivity analysis for fMRI.Front Neuroinform. 2014 May 5;8:45. doi: 10.3389/fninf.2014.00045. eCollection 2014. Front Neuroinform. 2014. PMID: 24847244 Free PMC article.
-
Exploring personalized structural connectomics for moderate to severe traumatic brain injury.Netw Neurosci. 2023 Jan 1;7(1):160-183. doi: 10.1162/netn_a_00277. eCollection 2023. Netw Neurosci. 2023. PMID: 37334004 Free PMC article.
-
The Network Modification (NeMo) Tool: elucidating the effect of white matter integrity changes on cortical and subcortical structural connectivity.Brain Connect. 2013;3(5):451-63. doi: 10.1089/brain.2013.0147. Brain Connect. 2013. PMID: 23855491 Free PMC article.
-
Increased gray matter diffusion anisotropy in patients with persistent post-concussive symptoms following mild traumatic brain injury.PLoS One. 2013 Jun 11;8(6):e66205. doi: 10.1371/journal.pone.0066205. Print 2013. PLoS One. 2013. PMID: 23776631 Free PMC article.
References
-
- Bates E., Wilson S. M., Saygin A. P., Dick F., Sereno M. I., Knight R. T., Dronkers N. F. (2003). Voxel-based lesion-symptom mapping. Nat. Neurosci. 6, 448–450 - PubMed