. 2012 Feb 21:3:48.
doi: 10.3389/fmicb.2012.00048. eCollection 2012.

Tracing lifestyle adaptation in prokaryotic genomes

Affiliations

Tracing lifestyle adaptation in prokaryotic genomes

Eric Altermann. Front Microbiol. .

Abstract

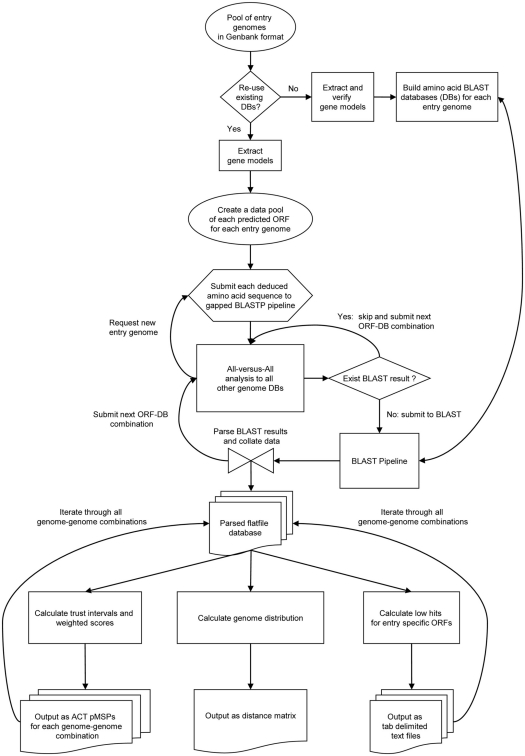
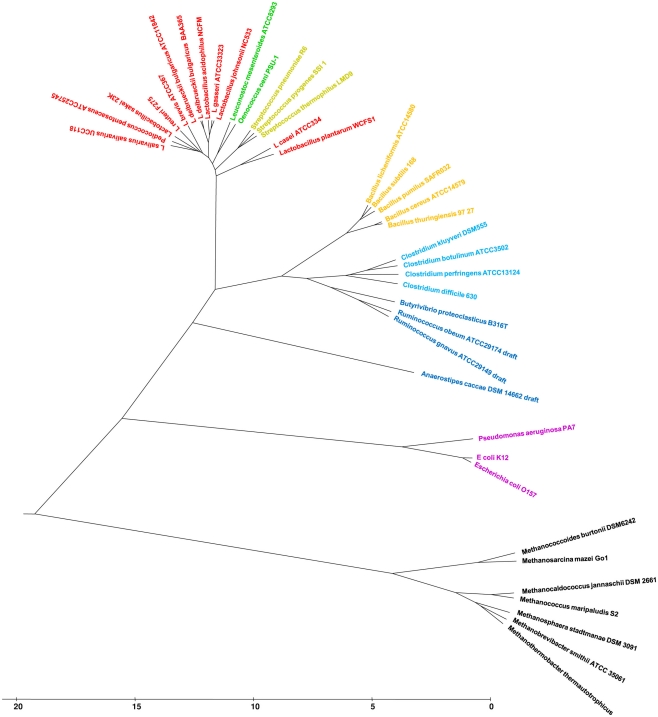
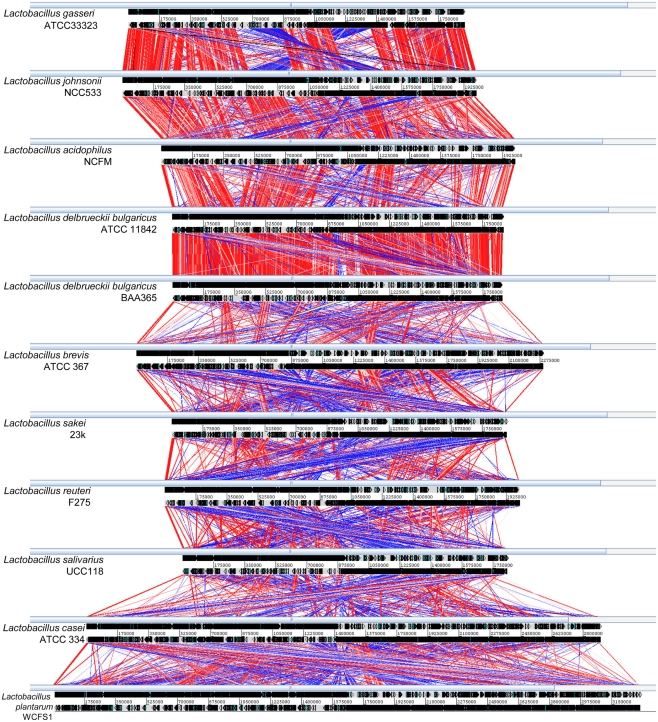
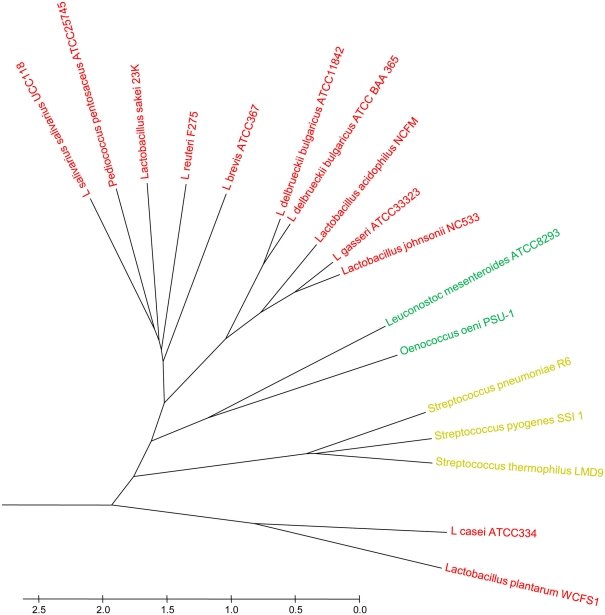
Lifestyle adaptation of microbes due to changes in their ecological niches or acquisition of new environments is a major driving force for genetic changes in their respective genomes. Moving into more specialized niches often results in the acquisition of new gene sets via horizontal gene transfer to utilize previously unavailable metabolites, while genetic ballast is shed by gene loss and/or gene inactivation. In some cases, larger genome rearrangements can be observed, such as the incorporation of whole genetic islands, providing a range of new phenotypic capabilities. Until recently these changes could not be comprehensively followed and identified due to the lack of complete microbial genome sequences. The advent of high-throughput DNA sequencing has dramatically changed the scientific landscape and today microbial genomes have become increasingly abundant. Currently, more than 2,900 genomes are published and more than 11,000 genome projects are listed in the Genomes Online Database. Although this wealth of information provides many new opportunities to assess microbial functionality, it also creates a new array of challenges when a comparison between multiple microbial genomes is required. Here, functional genome distribution (FGD) is introduced, analyzing the diversity between microbes based on their predicted ORFeome. FGD is therefore a comparative genomics approach, emphasizing the assessments of gene complements. To further facilitate the comparison between two or more genomes, degrees of amino-acid similarities between ORFeomes can be visualized in the Artemis comparison tool, graphically depicting small and large scale genome rearrangements, insertion and deletion events, and levels of similarity between individual open reading frames. FGD provides a new tool for comparative microbial genomics and the interpretation of differences in the genetic makeup of bacteria.

Keywords: functional genomics; genome comparison; genome plasticity; horizontal gene transfer; lifestyle adaption.


Figures

Figure 1
Figure 1
Graphical workflow of the compACTor software. Schematic representation of the algorithm structure. Symbols used are consistent with standard flowchart icons. Abbreviations: DB, database; pMSPs, ORFeome based MSPcrunch comparison format (Sonnhammer and Durbin, 1994) data files. Oval symbol: data pools, diamond symbol: internal decision points, square boxes: internal processes and functions, hourglass symbol: central parsing algorithm, Multidocument symbol: external flatfile databases created by compACTor.
Figure 2
Figure 2
Functional genome distribution of 39 taxa. Publicly available complete genomes were downloaded in GenBank format from the NCBI genome database. Publicly available draft phase genomes were downloaded in FASTA format, concatenated using a universal spacer-stop-spacer sequence and automatically annotated using GAMOLA (Altermann and Klaenhammer, 2003). The in-house draft phase genome of Butyrivibrio proteoclasticus was assembled into an artificial genome and annotated using GAMOLA (publication in preparation). Predicted ORFeomes of all genomes were subjected to an FGD analysis and the resulting distance matrix was imported into MEGA4. The functional distribution was visualized using the UPGMA method (Sneath and Sokal, 1962). The optimal tree with the sum of branch length = 133.1 is shown. The tree is drawn to scale, with branch lengths in the same units as those of the functional distances used to infer the distribution tree.
Figure 3
Figure 3
ORFeome based comparative ACT visualization of 11 Lactobacillus genomes. Based on the distribution observed in Figure 2, 11 Lactobacillus genomes and their ORFeome similarities were visualized in ACT using pMSP-datafiles. Respective genome designations are indicated on the left hand side of each genome line. Genomes are shown in full and drawn to scale. Genomic nucleotide sequences are represented by gray lines indicating sense and anti-sense strands and position markers are shown in between. Predicted ORFs are shown on each strand in their respective orientation as arrowed boxes. Direct amino-acid similarity between individual ORFs of neighboring genomes are shown as red lines, inverted similarities are indicated by blue lines. Color shadings indicate the level of similarity, the more saturated a similarity line the more conserved are two ORF-pairs. A trust level value of 40 was employed as display threshold to visualize similarity hits below an e-value of 1e-60.
Figure A1
Figure A1
Functional distribution tree of 17 closely related taxa within the class Bacilli. The tree represents a subset of the one shown in Figure 2. Predicted ORFeomes of all genomes were subjected to an FGD analysis and the resulting distance matrix was imported into MEGA4. The functional distribution was visualized using the UPGMA method (32). The tree is drawn to scale, with branch lengths in the same units as those of the functional distances used to infer the distribution tree.
Figure A2
Figure A2
A functional distribution tree comprising of 23 Chlamydia trachomatis genomes (host: human), three C. maridarum genomes (host: members of the family Muridae), and one C. pneumoniae genome were used to investigate genome similarities and the FGD-power-of-resolution on strain level. Entries in red depict Chlamydia trachomatis serotypes A–C (trachoma), entries in black represent serotypes D–K (sexually transmitted pathovars) and entries in green show serotype LGV (L1–L3; lymphogranuloma venereum). Chlamydia muridarum entries are shown in blue and Chalmydia pneumoniae is depicted in gray. Functional clusters and subclusters are indicated by square brackets.

References

    1. Altermann E., Klaenhammer T. R. (2003). GAMOLA: a new local solution for sequence annotation and analyzing draft and finished prokaryotic genomes. OMICS 7, 161–16910.1089/153623103322246557 - DOI - PubMed
    1. Altermann E., Russell W. M., Azcarate-Peril M. A., Barrangou R., Buck B. L., Mcauliffe O., Souther N., Dobson A., Duong T., Callanan M., Lick S., Hamrick A., Cano R., Klaenhammer T. R. (2005). Complete genome sequence of the probiotic lactic acid bacterium Lactobacillus acidophilus NCFM. Proc. Natl. Acad. Sci. U.S.A. 102, 3906–391210.1073/pnas.0409188102 - DOI - PMC - PubMed
    1. Altschul S. F., Gish W., Miller W., Myers E. W., Lipman D. J. (1990). Basic local alignment search tool. J. Mol. Biol. 215, 403–41010.1016/S0022-2836(05)80360-2 - DOI - PubMed
    1. Altschul S. F., Madden T. L., Schaffer A. A., Zhang J., Zhang Z., Miller W., Lipman D. J. (1997). Gapped BLAST and PSI-BLAST: a new generation of protein database search programs. Nucleic Acids Res. 25, 3389–340210.1093/nar/25.17.3389 - DOI - PMC - PubMed
    1. Azcarate-Peril M. A., Altermann E., Goh Y. J., Tallon R., Sanozky-Dawes R. B., Pfeiler E. A., O’flaherty S., Buck B. L., Dobson A., Duong T., Miller M. J., Barrangou R., Klaenhammer T. R. (2008). Analysis of the genome sequence of Lactobacillus gasseri ATCC 33323 reveals the molecular basis of an autochthonous intestinal organism. Appl. Environ. Microbiol. 74, 4610–462510.1128/AEM.00054-08 - DOI - PMC - PubMed

LinkOut - more resources