. 2012;7(2):e29782.
doi: 10.1371/journal.pone.0029782. Epub 2012 Feb 20.

Novel protein kinase signaling systems regulating lifespan identified by small molecule library screening using Drosophila

Affiliations

Novel protein kinase signaling systems regulating lifespan identified by small molecule library screening using Drosophila

Stephen R Spindler et al. PLoS One. 2012.

Abstract

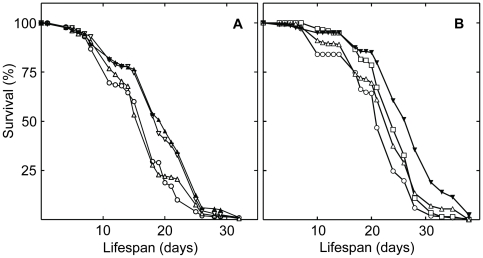
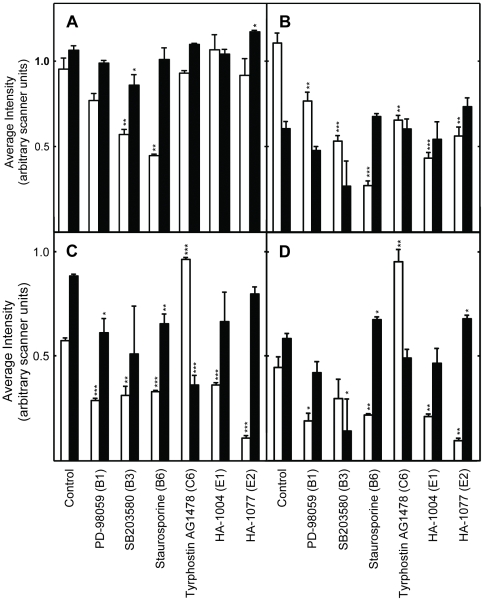
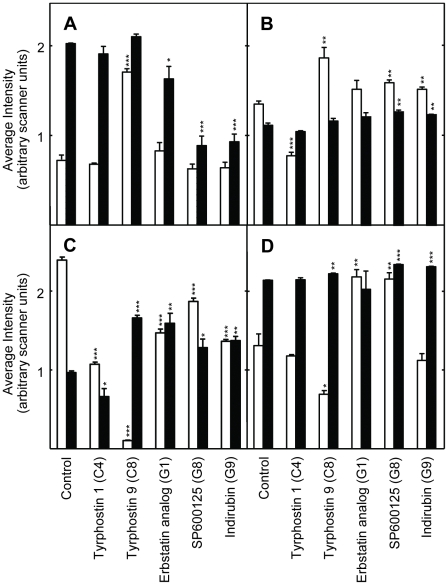
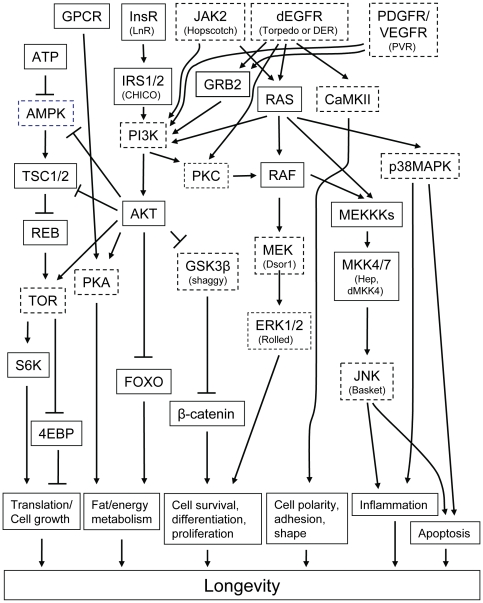
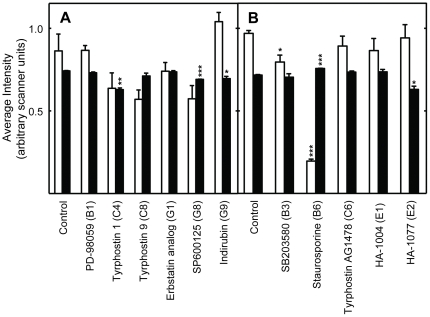
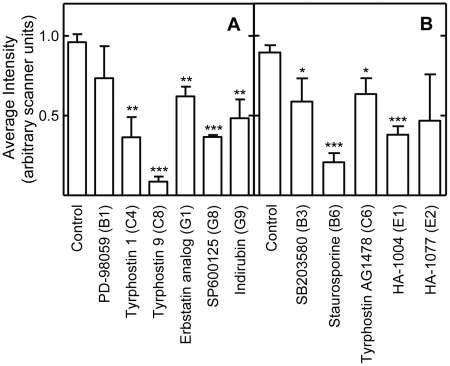
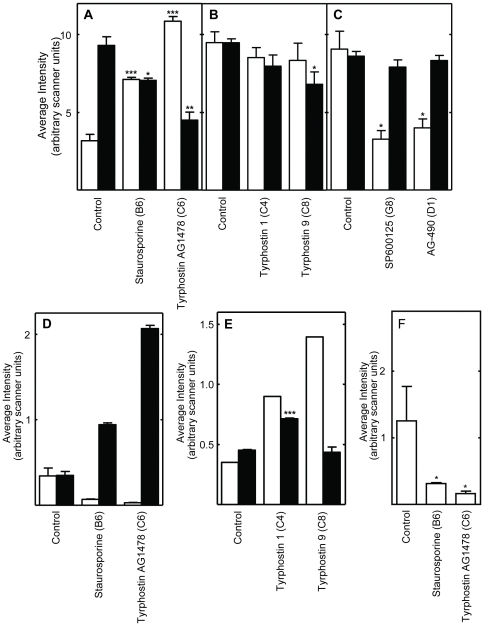
Protein kinase signaling cascades control most aspects of cellular function. The ATP binding domains of signaling protein kinases are the targets of most available inhibitors. These domains are highly conserved from mammals to flies. Herein we describe screening of a library of small molecule inhibitors of protein kinases for their ability to increase Drosophila lifespan. We developed an assay system which allowed screening using the small amounts of materials normally present in commercial chemical libraries. The studies identified 17 inhibitors, the majority of which targeted tyrosine kinases associated with the epidermal growth factor receptor (EGFR), platelet-derived growth factor (PDGF)/vascular endothelial growth factor (VEGF) receptors, G-protein coupled receptor (GPCR), Janus kinase (JAK)/signal transducer and activator of transcription (STAT), the insulin and insulin-like growth factor (IGFI) receptors. Comparison of the protein kinase signaling effects of the inhibitors in vitro defined a consensus intracellular signaling profile which included decreased signaling by p38MAPK (p38), c-Jun N-terminal kinase (JNK) and protein kinase C (PKC). If confirmed, many of these kinases will be novel additions to the signaling cascades known to regulate metazoan longevity.


Conflict of interest statement

Competing Interests: The authors have read the journal's policy and have the following conflicts: This study was supported by Alva LLC. Alva's funder, a high net worth individual, prefers to remain anonymous. This does not alter the authors' adherence to all the PLoS ONE policies on sharing data and materials, as detailed online in the guide for authors.

Figures

Figure 1
Figure 1. Rescreening results of drugs identified in an initial screening the Biomol protein kinase inhibitor library.
Figure 2
Figure 2. Effects of the protein kinase inhibitors on intracellular signaling in Drosophila S2 cells treated for 48 hours with the protein kinase inhibitors indicated at the bottom of the panels.
Panel A shows data obtained using antibodies to phospho-Erk1/2 (white bars), and total Erk1/2 (black bars). Panel B shows data obtained using antibodies to phospho-Mek1/2 (white bars), and total Mek1/2 (black bars). Panel C shows data obtained using antibodies to phospho-p38 MAPK (white bars), and total p38 MAPK (black bars). Panel D shows data obtained using antibodies to phospho-JNK (white bars), and total JNK (black bars). The height of each bar represents the the signal normalized to the total amount of protein in each sample as judged by comparison to several apparently invariant protein bands observed on the blot by Ponceau S staining (representative staining is shown in Figure S4A). One asterisk indicates the changes were significant (P≤0.05); two asterisks indicates the results were highly significant (P≤0.01), and three indicates it is very highly significant (P≤0.001). See Figure S4A for representative Western blots and protein bands visualized using Ponceau S staining of membranes.
Figure 3
Figure 3. Effects of the protein kinase inhibitors on intracellular signaling in Drosophila S2 cells treated for 48 hours with the protein kinase inhibitors indicated at the bottom of the panels.
The antibodies used to obtain data for each panel and the color coding of the data bars are as described for Figure 2. Data normalization was performed as described in Figure 2. The symbols indicating statistical significance are as in Figure 2. See Figure S4B and C for representative Western blots and Ponceau S stained protein.
Figure 4
Figure 4. PKC activity determined using antibodies to phosphorylated substrates of PKC in extracts of S2 cells treated for 48 hours with the indicated protein kinase inhibitors.
Panels A and B show results for different subsets of the inhibitors. The labeling and symbols are as described in the legend to Figure 2. See Figure S6 for representative Western blots.
Figure 5
Figure 5. The level of phosphorylated AMPKα (white bars) and non-phosphorylated MPKα1+α2 (black bars) determined using Western blots prepared using protein extracts of S2 cells treated for 48 hours with the protein kinase inhibitors.
Panels A and B show the data from one of two Western blots using control cells or cells treated with the indicated inhibitors. The labeling and symbols are as described in the legend to Figure 2. See Figure S7 for representative Western blots.
Figure 6
Figure 6. An abridged, consensus, protein-kinase signaling network assembled by examination of the Drosophila and mammalian literature.
Figure 7
Figure 7. Effects of the indicated protein kinase inhibitors on site-specific phosphorylation determined using Western blots prepared using whole body protein extracts of Drosophila treated with various protein kinase inhibitors.
Shown in panels A, B and C are the results obtained with antibodies specific to phosphorylated and total JNK; in panel D and E, the results obtained with antibodies to phosphorylated and total AMPK; and in panel F the results from antibodies to phosphorylated substrates of PKC. The inhibitors used in each study are indicated at the bottom of the panels. The symbols are as described in the legend to Figure 2. See Figure S5 for representative Western blots. In panel E, the control phosphorylated-AMPKα expression levels are derived from the averages of only 2 independent replicates, due to sample loss. All other data are derived from 3 independent replicates. See Figure S5 for representative Western blots.
Figure 8
Figure 8. The effects of protein kinase inhibitors on the activation of ERK1/2 signaling in intact Drosophila.
ERK1/2 activation in Drosophila fed the inhibitors in their food were determined using Western blots probed with a phosphorylation site- or total protein-specific antibody. The labeling and symbols are as described in the legend to Figure 2. Panels A through C represent data from 3 different Western blots. See Figure S8 for representative Western blots.

Similar articles

Cited by

References

    1. Fontana L, Partridge L, Longo VD. Extending healthy life span–from yeast to humans. Science. 2010;328:321–326. - PMC - PubMed
    1. Spindler SR. Caloric restriction: From soup to nuts. Ageing Res Rev. 2010;9:324–353. - PubMed
    1. Kalaany NY, Sabatini DM. Tumours with PI3K activation are resistant to dietary restriction. Nature. 2009;458:725–731. - PMC - PubMed
    1. Aritakula A, Ramasamy A. Drosophila-based in vivo assay for the validation of inhibitors of the epidermal growth factor receptor/Ras pathway. J Biosci. 2008;33:731–742. - PubMed
    1. Bain J, McLauchlan H, Elliott M, Cohen P. The specificities of protein kinase inhibitors: an update. Biochem J. 2003;371:199–204. - PMC - PubMed

Publication types

MeSH terms

LinkOut - more resources