

Reconsidering association testing methods using single-variant test statistics as alternatives to pooling tests for sequence data with rare variants
- PMID: 22363423
- PMCID: PMC3281828
- DOI: 10.1371/journal.pone.0030238
Reconsidering association testing methods using single-variant test statistics as alternatives to pooling tests for sequence data with rare variants
Abstract
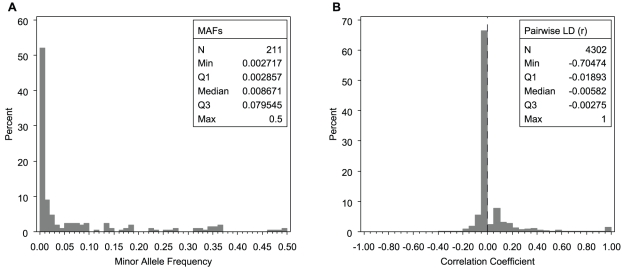
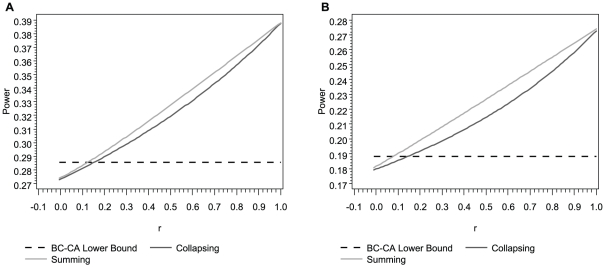
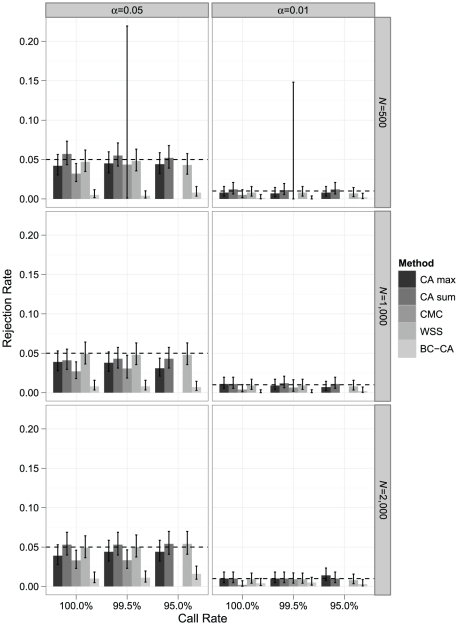
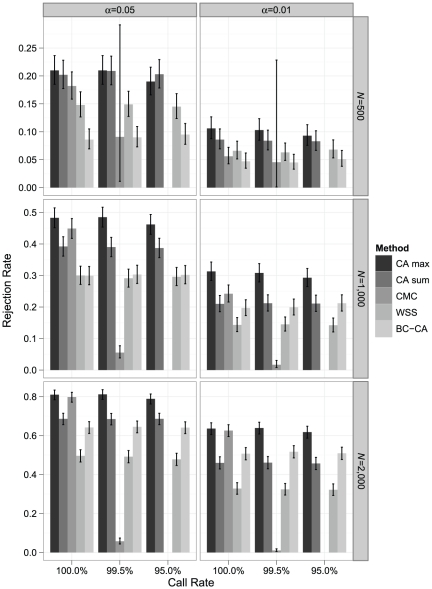
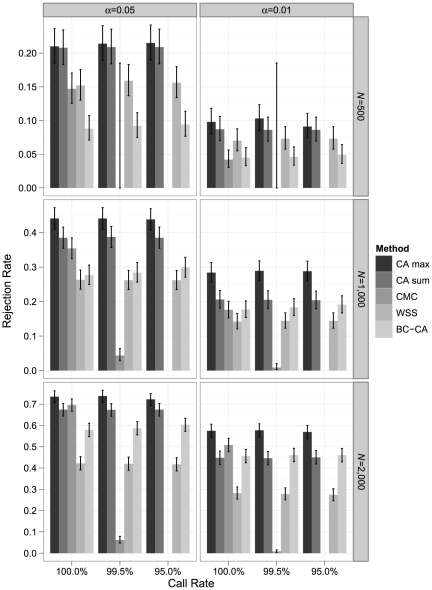
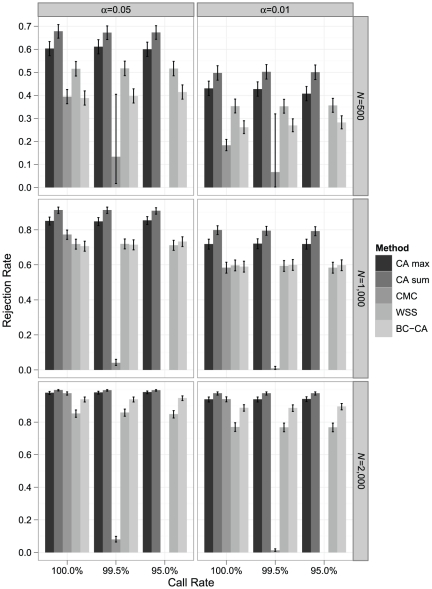
Association tests that pool minor alleles into a measure of burden at a locus have been proposed for case-control studies using sequence data containing rare variants. However, such pooling tests are not robust to the inclusion of neutral and protective variants, which can mask the association signal from risk variants. Early studies proposing pooling tests dismissed methods for locus-wide inference using nonnegative single-variant test statistics based on unrealistic comparisons. However, such methods are robust to the inclusion of neutral and protective variants and therefore may be more useful than previously appreciated. In fact, some recently proposed methods derived within different frameworks are equivalent to performing inference on weighted sums of squared single-variant score statistics. In this study, we compared two existing methods for locus-wide inference using nonnegative single-variant test statistics to two widely cited pooling tests under more realistic conditions. We established analytic results for a simple model with one rare risk and one rare neutral variant, which demonstrated that pooling tests were less powerful than even Bonferroni-corrected single-variant tests in most realistic situations. We also performed simulations using variants with realistic minor allele frequency and linkage disequilibrium spectra, disease models with multiple rare risk variants and extensive neutral variation, and varying rates of missing genotypes. In all scenarios considered, existing methods using nonnegative single-variant test statistics had power comparable to or greater than two widely cited pooling tests. Moreover, in disease models with only rare risk variants, an existing method based on the maximum single-variant Cochran-Armitage trend chi-square statistic in the locus had power comparable to or greater than another existing method closely related to some recently proposed methods. We conclude that efficient locus-wide inference using single-variant test statistics should be reconsidered as a useful framework for devising powerful association tests in sequence data with rare variants.
Conflict of interest statement
Figures
Similar articles
-
Extending rare-variant testing strategies: analysis of noncoding sequence and imputed genotypes.Am J Hum Genet. 2010 Nov 12;87(5):604-17. doi: 10.1016/j.ajhg.2010.10.012. Am J Hum Genet. 2010. PMID: 21070896 Free PMC article.
-
General framework for meta-analysis of rare variants in sequencing association studies.Am J Hum Genet. 2013 Jul 11;93(1):42-53. doi: 10.1016/j.ajhg.2013.05.010. Epub 2013 Jun 13. Am J Hum Genet. 2013. PMID: 23768515 Free PMC article.
-
A powerful association test of multiple genetic variants using a random-effects model.Stat Med. 2014 May 20;33(11):1816-27. doi: 10.1002/sim.6068. Epub 2013 Dec 16. Stat Med. 2014. PMID: 24338936 Free PMC article.
-
A haplotype-based framework for group-wise transmission/disequilibrium tests for rare variant association analysis.Bioinformatics. 2015 May 1;31(9):1452-9. doi: 10.1093/bioinformatics/btu860. Epub 2015 Jan 6. Bioinformatics. 2015. PMID: 25568282 Free PMC article.
-
Statistical analysis of rare sequence variants: an overview of collapsing methods.Genet Epidemiol. 2011;35 Suppl 1(Suppl 1):S12-7. doi: 10.1002/gepi.20643. Genet Epidemiol. 2011. PMID: 22128052 Free PMC article. Review.
Cited by
-
A hybrid likelihood model for sequence-based disease association studies.PLoS Genet. 2013;9(1):e1003224. doi: 10.1371/journal.pgen.1003224. Epub 2013 Jan 24. PLoS Genet. 2013. PMID: 23358228 Free PMC article.
-
Linear regression in genetic association studies.PLoS One. 2013;8(2):e56976. doi: 10.1371/journal.pone.0056976. Epub 2013 Feb 21. PLoS One. 2013. PMID: 23437286 Free PMC article.
-
Single-variant and multi-variant trend tests for genetic association with next-generation sequencing that are robust to sequencing error.Hum Hered. 2012;74(3-4):172-83. doi: 10.1159/000346824. Epub 2013 Apr 11. Hum Hered. 2012. PMID: 23594495 Free PMC article.
-
The Complex and Diverse Genetic Architecture of Dilated Cardiomyopathy.Circ Res. 2021 May 14;128(10):1514-1532. doi: 10.1161/CIRCRESAHA.121.318157. Epub 2021 May 13. Circ Res. 2021. PMID: 33983834 Free PMC article. Review.
-
The impact of population demography and selection on the genetic architecture of complex traits.PLoS Genet. 2014 May 29;10(5):e1004379. doi: 10.1371/journal.pgen.1004379. eCollection 2014. PLoS Genet. 2014. PMID: 24875776 Free PMC article.
References
-
- McClellan J, King M-C. Genetic heterogeneity in human disease. Cell. 2010;141:210–217. - PubMed
Publication types
MeSH terms
Grants and funding
LinkOut - more resources
Full Text Sources
