

Scaling effects and spatio-temporal multilevel dynamics in epileptic seizures
- PMID: 22363431
- PMCID: PMC3281841
- DOI: 10.1371/journal.pone.0030371
Scaling effects and spatio-temporal multilevel dynamics in epileptic seizures
Abstract
Epileptic seizures are one of the most well-known dysfunctions of the nervous system. During a seizure, a highly synchronized behavior of neural activity is observed that can cause symptoms ranging from mild sensual malfunctions to the complete loss of body control. In this paper, we aim to contribute towards a better understanding of the dynamical systems phenomena that cause seizures. Based on data analysis and modelling, seizure dynamics can be identified to possess multiple spatial scales and on each spatial scale also multiple time scales. At each scale, we reach several novel insights. On the smallest spatial scale we consider single model neurons and investigate early-warning signs of spiking. This introduces the theory of critical transitions to excitable systems. For clusters of neurons (or neuronal regions) we use patient data and find oscillatory behavior and new scaling laws near the seizure onset. These scalings lead to substantiate the conjecture obtained from mean-field models that a Hopf bifurcation could be involved near seizure onset. On the largest spatial scale we introduce a measure based on phase-locking intervals and wavelets into seizure modelling. It is used to resolve synchronization between different regions in the brain and identifies time-shifted scaling laws at different wavelet scales. We also compare our wavelet-based multiscale approach with maximum linear cross-correlation and mean-phase coherence measures.
Conflict of interest statement
Figures
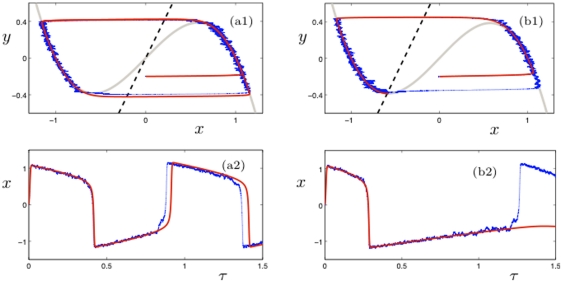
 . The critical manifold
  is shown in grey and the
  -nullcline as a dashed black curve. (a)
  , the equilibrium for the full system lies on
  . (b)
. (b)  , the equilibrium lies on
  near the fold point
  . The deterministic trajectory has only one spike while noise-induced escapes produce repeated spiking for the stochastic system.
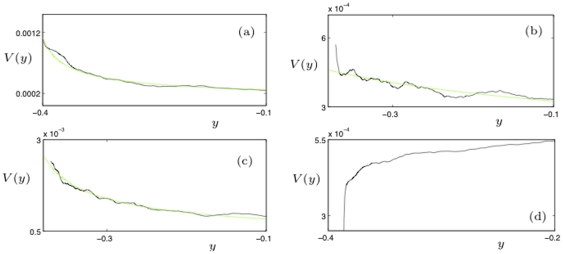
 using (4) with fitting parameters
  and
and  . Fixed parameter values are
  . (a) Relaxation oscillation regime with
  . (b) Excitable regime with
  ; sample paths can exhibit oscillations around the stable focus equilibrium
  which are visible in the variance. (c) Excitable regime with
  where larger noise regularizes the variance similar to (a). (d) Excitable regime
  where smaller noise does not allow fast escapes from
  and yields decreasing variance.
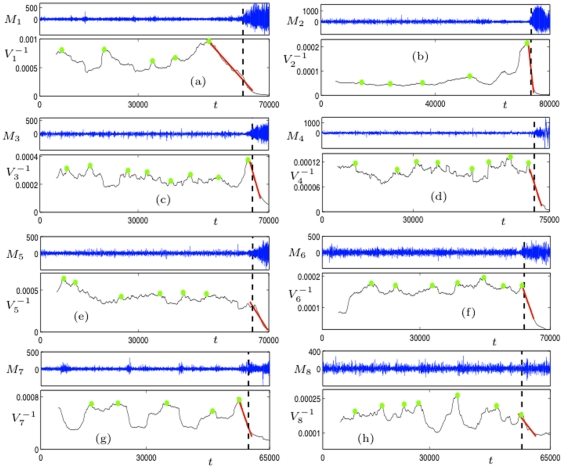
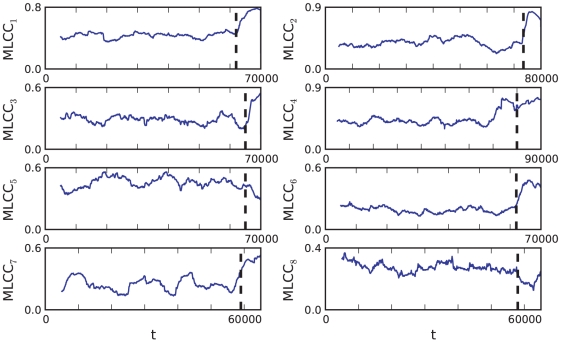
 (5000 points). The green dots mark some local maxima of
  which correspond to local minima of
  . The fitted red curves are linear and demonstrate that the variance increases near the epileptic seizure. The black dashed vertical lines are inserted for orientation purposes, separating the two regions of low and high variance.
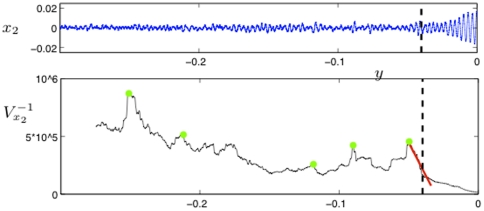
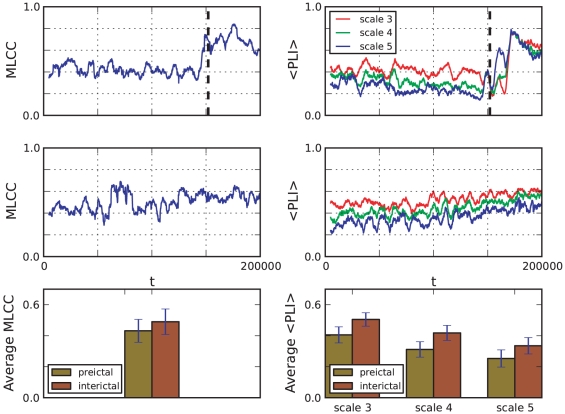
 for three scales during a pre-ictal (top) and an inter-ictal (middle) period are depicted. Vertical dashed lines indicate the onset of the seizure attack. Averages over the first 150000 sample points of each time series indicate a distinct decrease of each synchronization measure during the pre-ictal interval (bottom row). Error bars show standard deviations.
Similar articles
-
Measuring resetting of brain dynamics at epileptic seizures: application of global optimization and spatial synchronization techniques.J Comb Optim. 2009 Jan;17(1):74-97. doi: 10.1007/s10878-008-9181-x. J Comb Optim. 2009. PMID: 21709753 Free PMC article.
-
Nonlinear dynamics of seizure prediction in a rodent model of epilepsy.Nonlinear Dynamics Psychol Life Sci. 2010 Oct;14(4):411-34. Nonlinear Dynamics Psychol Life Sci. 2010. PMID: 20887688
-
Wavelet based algorithm for the estimation of frequency flow from electroencephalogram data during epileptic seizure.Clin Neurophysiol. 2011 Apr;122(4):680-6. doi: 10.1016/j.clinph.2010.10.030. Epub 2010 Nov 13. Clin Neurophysiol. 2011. PMID: 21075680
-
Emergence of semiology in epileptic seizures.Epilepsy Behav. 2014 Sep;38:94-103. doi: 10.1016/j.yebeh.2013.12.003. Epub 2014 Jan 11. Epilepsy Behav. 2014. PMID: 24424286 Review.
-
Evolving Mechanistic Concepts of Epileptiform Synchronization and their Relevance in Curing Focal Epileptic Disorders.Curr Neuropharmacol. 2019;17(9):830-842. doi: 10.2174/1570159X17666181127124803. Curr Neuropharmacol. 2019. PMID: 30479217 Free PMC article. Review.
Cited by
-
Critical slowing down as a biomarker for seizure susceptibility.Nat Commun. 2020 May 1;11(1):2172. doi: 10.1038/s41467-020-15908-3. Nat Commun. 2020. PMID: 32358560 Free PMC article.
-
The critical dynamics of hippocampal seizures.Nat Commun. 2024 Aug 13;15(1):6945. doi: 10.1038/s41467-024-50504-9. Nat Commun. 2024. PMID: 39138153 Free PMC article.
-
Antiepileptic drugs induce subcritical dynamics in human cortical networks.Proc Natl Acad Sci U S A. 2020 May 19;117(20):11118-11125. doi: 10.1073/pnas.1911461117. Epub 2020 May 1. Proc Natl Acad Sci U S A. 2020. PMID: 32358198 Free PMC article.
-
Multi-scale visual analysis of time-varying electrocorticography data via clustering of brain regions.BMC Bioinformatics. 2017 Jun 6;18(Suppl 6):236. doi: 10.1186/s12859-017-1633-9. BMC Bioinformatics. 2017. PMID: 28617218 Free PMC article.
-
Deep Brain Stimulation for Epilepsy: Biomarkers for Optimization.Curr Treat Options Neurol. 2019 Sep 26;21(10):47. doi: 10.1007/s11940-019-0590-1. Curr Treat Options Neurol. 2019. PMID: 31559493 Review.
References
-
- Mormann F, Andrzejak R, Elger C, Lehnertz K. Seizure prediction: the long and winding road. Brain. 2007;130:314–333. - PubMed
-
- Schelter B, Timmer J, Schulze-Bonhage A, editors. Seizure Predicition in Epilepsy. Wiley; 2008.
-
- Litt B, Echauz J. Prediction of epileptic seizures. The Lancet Neurology. 2002;1:22–30. - PubMed
-
- Robinson P, Rennie C, Rowe D. Dynamics of large-scale brain activity in normal arousal states and epileptic seizures. Phys Rev E. 2002;65:041924. - PubMed
